
Structural Fingerprints: How Local Topology Reveals the Hidden Pulse of Social Networks
Structural Changes in an Email-Based Social Network
This paper investigates the structural evolution of a large-scale email-based social network at Wroclaw University of Technology over 20 months. By applying Centrality measures, Clustering Coefficients, and Motif Analysis, the authors identify that while global metrics remain stable, local topology fluctuates significantly in correlation with organizational cycles.
TL;DR
By analyzing 20 months of email logs from a major technical university, this study reveals a fascinating paradox: while the "global" skeleton of a social network (how central people are) remains almost frozen in time, the "local" environment (how small groups form) pulses with high-frequency changes. These local shifts, captured through Clustering Coefficients and Motif Analysis, accurately map to real-world events like summer holidays and semester breaks.
Background: The Static vs. Dynamic View
Social Network Analysis (SNA) often provides a snapshot of "who knows whom." However, digital networks are living organisms. Previous work has often struggled to identify which metrics truly capture the dynamics of a network. Is it the total number of users? The average distance between people? Or the way small "cliques" form?
The authors argue that global indices—the ones usually used to rank importance—might be too "blunt" to see the subtle shifts in how we actually communicate.
The "Macro" Stability vs. "Micro" Turbulence
The most striking finding of the paper is the stability of global centrality measures. Despite the network size fluctuating between 3,257 and 4,465 nodes due to academic cycles, the Closeness and Betweenness Centrality remained virtually constant.
- Insight: The "role" of actors as intermediaries or how "close" everyone is to each other appears to be an inherent property of the network's architecture, surviving even as thousands of edges disappear during summer.
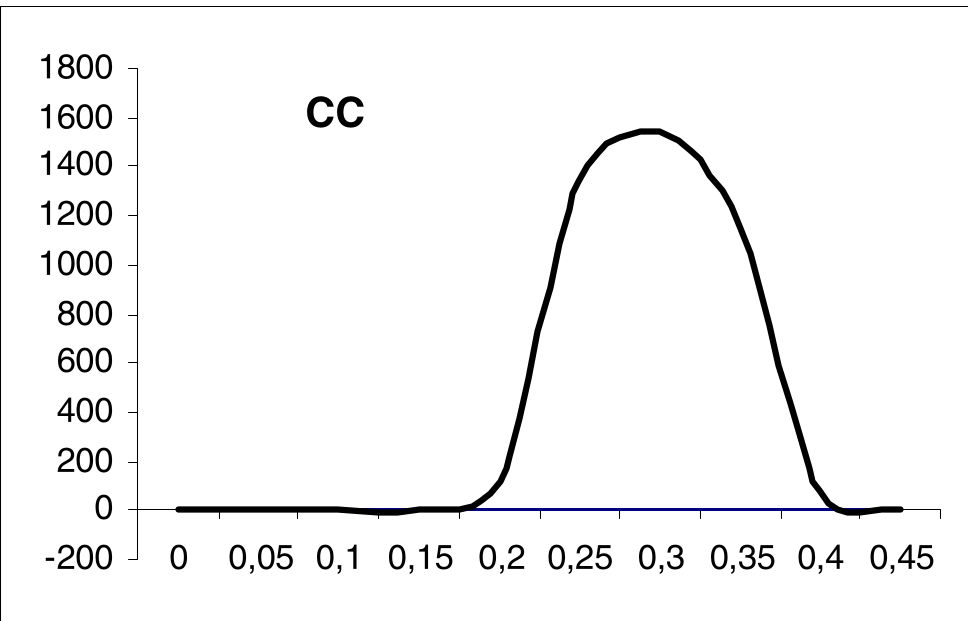 Figure 1: While node distribution remains stable, the underlying "local" activity tells a different story.
Methodology: Zooming into the Neighborhood
To find the actual changes, the authors shifted focus from the whole graph to the local neighborhood.
1. Clustering Coefficients (CC1 & CC2)
Instead of just looking at the whole network's density, they measured the 1-neighborhood and 2-neighborhood clustering. CC2 (measuring the density of connections in the extended neighborhood) proved to be a highly sensitive "thermometer" for network activity.
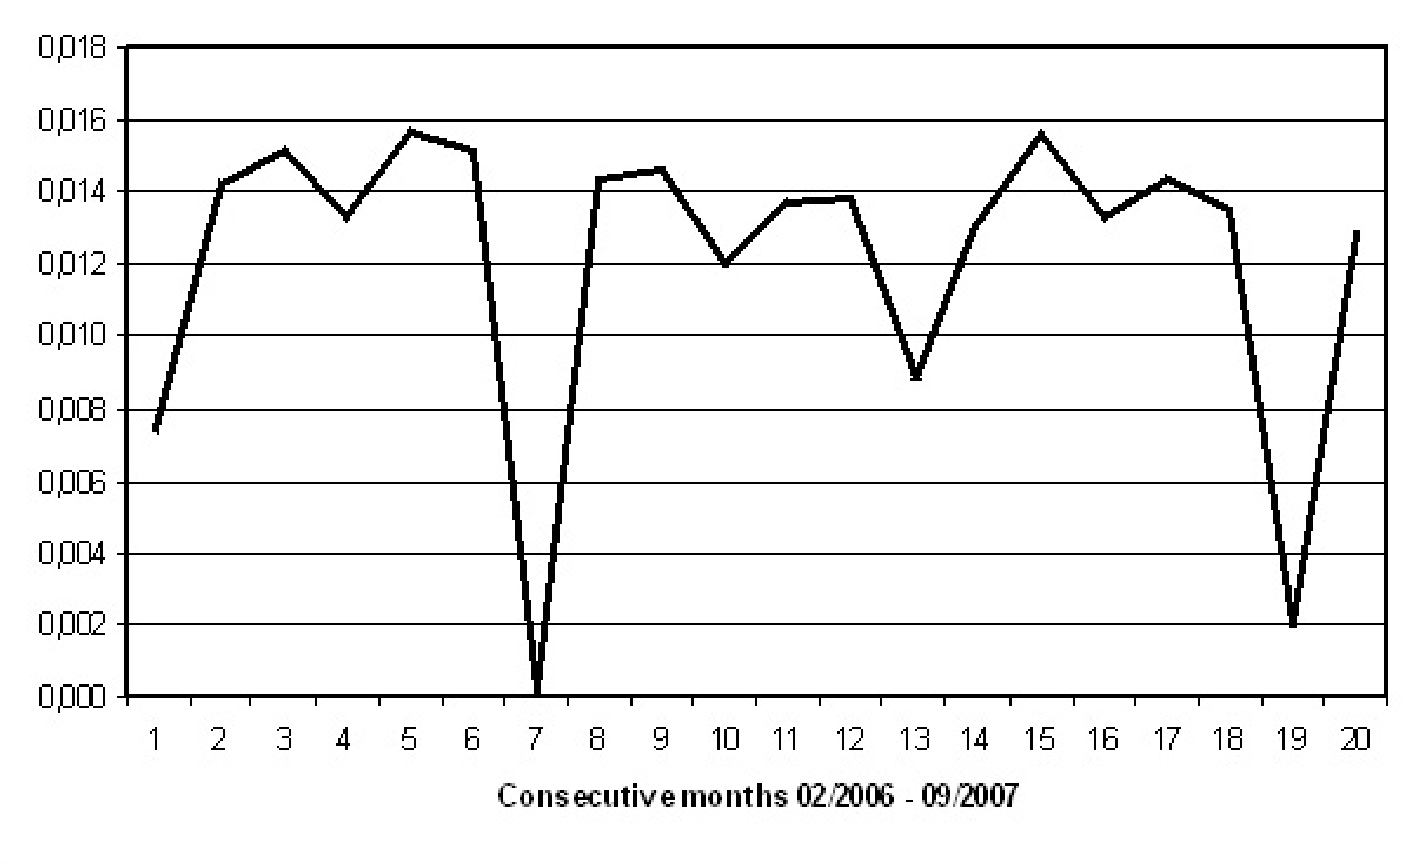 Figure 2: CC2 values clearly plummet during August (Summer) and February (Winter), tracking the academic calendar.
2. Motif Analysis (The Triad Significance Profile)
The researchers looked at 13 possible ways three people can be connected (Motifs).
- M1 (Broadcasting): One person sending emails to two others who don't reply. This is common in "business as usual" periods.
- M13 (Clique): A fully connected triangle where everyone talks to everyone. This structure is surprisingly resilient—even when overall email traffic drops during holidays, these "hardcore" cliques persist.
Why it Matters: Local Intelligence
The research concludes with a powerful practical implication: You don't need a map of the whole world to know what's changing in your city.
The fact that local metrics (CC2 and Motifs) are the best indicators of change suggests that autonomous software agents could monitor network health or evolution by only looking at their "immediate neighbors." This significantly reduces the computational overhead required for analyzing massive, real-time communication data.
Critical Analysis & Conclusion
While the paper provides a robust temporal analysis, it focuses primarily on the topology rather than the content or weight of the communications (e.g., email volume). Future research into "Strong vs. Weak ties" within these motifs could further refine our understanding of network resilience.
Key Takeaway: If you want to detect a shift in a social network, stop looking at the "Influencers" (Global Centrality) and start looking at the "Small Groups" (Local Motifs). The pulse of the network is in its smallest patterns.