
Hierarchical Transformations: Unveiling Structural DNA in Social Networks
Structure-Based Hierarchical Transformations for Interactive Visual Exploration of Social Networks
This paper introduces a novel structural hierarchical transformation for social networks based on "expansion vectors" of graph invariants. By clustering nodes with similar structural connectivity profiles across multiple distances (hops), it provides a multi-level visual exploration tool implemented in the Invenio framework to identify structural redundancy and roles.
TL;DR
Visualizing large-scale social networks is often a "hairball" problem where structural roles are hidden. This paper introduces a method to transform graphs into Structural Hierarchies using Expansion Vectors. By grouping nodes that see the network "the same way" at different distances, it allows analysts to find structural doppelgängers across complex datasets.
The "Structural Blindness" Problem
In social network analysis, we often ask: “Who are the most influential people?” We use scalar metrics like Degree or Betweenness Centrality. However, these scalars are one-dimensional. Two nodes might both have a degree of 3, but one is the center of a local cluster while the other is a bridge to a massive distant community.
Current visual mining tools require tedious manual inspection to find these patterns. The authors argue that we need a way to see the structural landscape—a way to identify nodes that occupy the same functional "position" in the topology without being directly connected.
Methodology: The Expansion Vector
The core innovation is the Expansion Vector. Instead of a single number, every node is assigned a vector that describes its "view" of the network at distance up to the graph's diameter.
1. Mathematical Intuition
The -hop degree counts how many nodes are exactly steps away.
- At , it's the standard degree.
- At , it's the number of "friends of friends" (excluding direct friends).
The resulting vector acts as a structural fingerprint.
2. From Vector to Hierarchy
These vectors are treated as paths in a prefix tree. If two nodes have identical expansion vectors, they end up at the same leaf node in the hierarchy. This transforms a non-linear graph into a navigable tree structure.
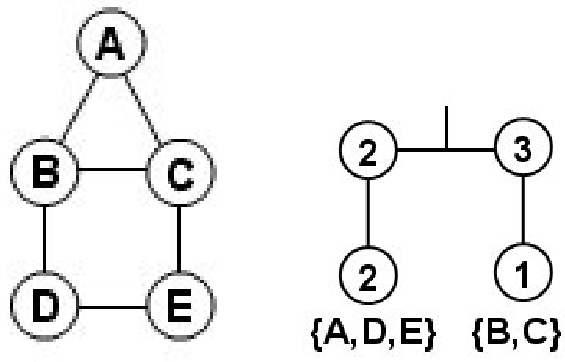 Figure 1: A toy graph (left) and its corresponding structural hierarchy (right). Nodes A, D, and E share the same expansion path (2, 2), indicating structural equivalence.
Case Study: Co-authorship Networks
The authors integrated this method into Invenio, a visual mining tool. They analyzed a network of 1,589 scientists. By using a dual-screen interface, users could select a branch in the hierarchy and immediately see the corresponding nodes highlighted in the original graph.
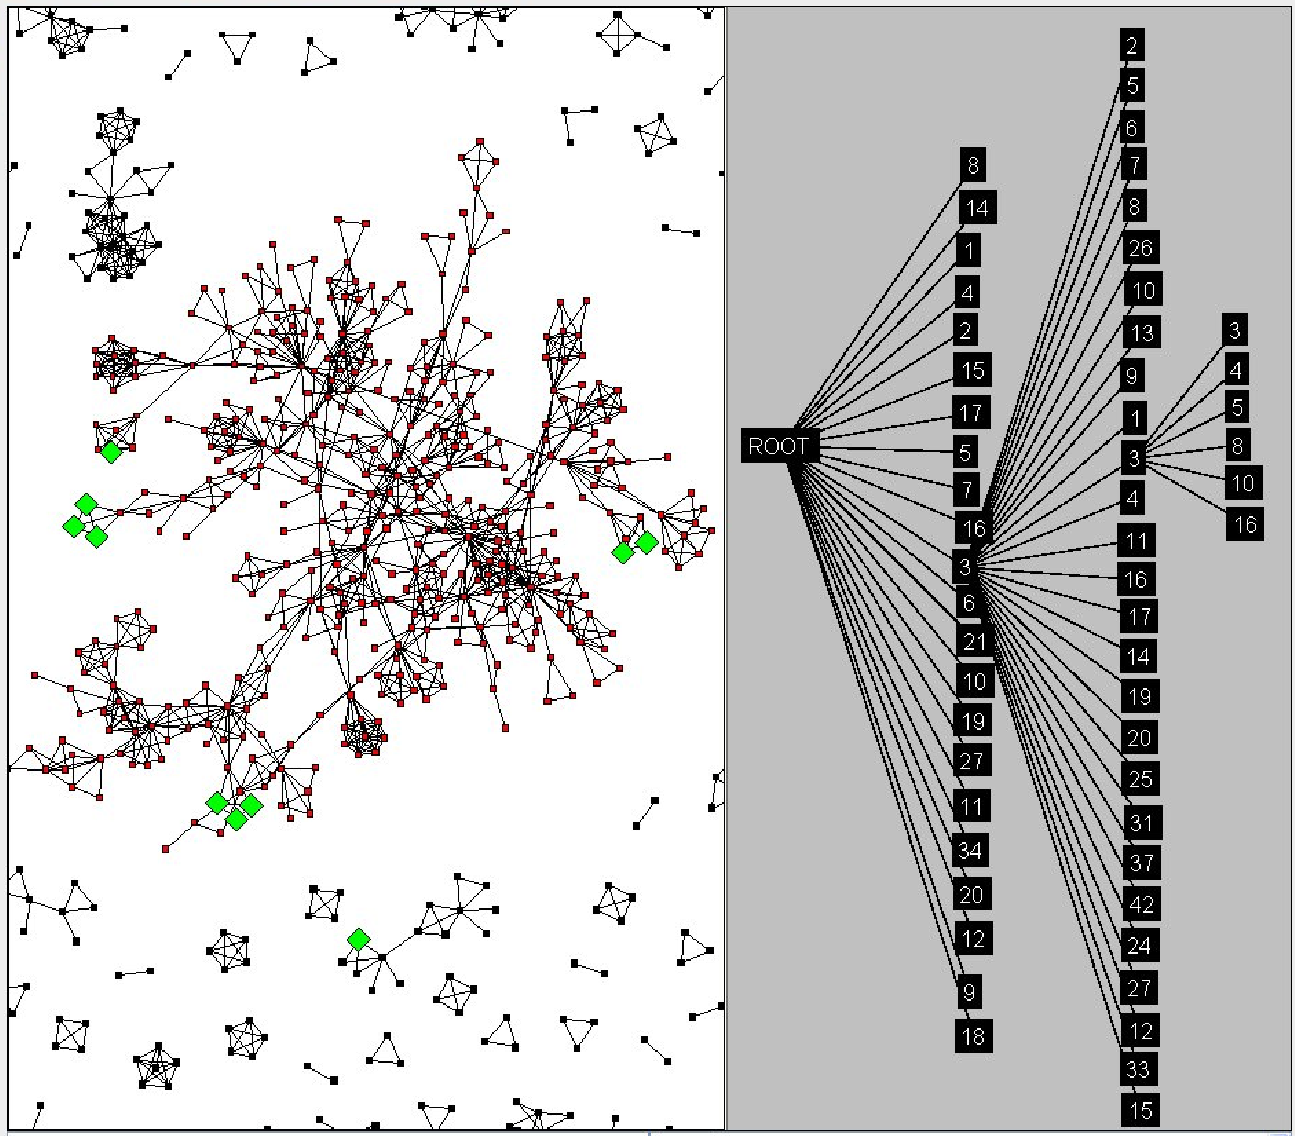 Figure 2: The Invenio dual-view. The left panel shows the traditional graph, while the right shows the structural hierarchy. Selecting a structural "type" in the tree reveals disparate nodes in the graph that play the same role.
Key Findings
- Structural Redundancy: The hierarchy reveals that different communities often have identical internal structures (e.g., a "star" hub or a "chain" link).
- Information Flow: If branches in the hierarchy are balanced/similar, information propagates evenly. If the tree is highly skewed, the network contains unique structural bottlenecks.
Critical Analysis & Conclusion
Takeaway
This work shifts the focus from semantic hierarchies (like organizational charts) to topological hierarchies. It provides a formal bridge between graph theory invariants and interactive visualization. It is particularly useful for Anomaly Detection—identifying nodes that look structurally unique—and Role Discovery.
Limitations
- Resolution: For very large networks, "exact" expansion vectors might be too diverse, leading to a shallow, wide tree. The authors suggest "binning" or rounding values as a future solution.
- Computational Cost: While calculating all-pairs shortest paths is manageable for thousands of nodes, it becomes a bottleneck for millions.
Future Outlook
The next step for this research is the integration of Semantic Content into the hierarchy. Imagine a tree where branches represent both "How many people you know" and "What topics you talk about." This would allow for even more granular discovery of social dynamics in the age of Big Data.