
Netvizz: Unlocking the "Walled Garden" of Facebook for Digital Sociology
Studying Facebook via Data Extraction: The Netvizz Application
This paper introduces Netvizz, a data extraction tool designed for social science and media studies researchers to export structured data from Facebook. It enables the quantitative and qualitative analysis of friendship networks, groups, and pages by bridging the gap between Facebook's API and standard analysis software like Gephi.
TL;DR
At the height of Facebook's global dominance, Bernhard Rieder's Netvizz application emerged as a crucial bridge for social scientists. By transforming Facebook's API into a research-friendly data pipeline, it allowed scholars to analyze the complex social topologies of friendship networks, groups, and pages. It effectively lowered the technical barrier for quantitative media studies, enabling researchers to move from speculative arguments to evidence-based Social Network Analysis (SNA).
The "Walled Garden" Problem: Motivation behind Netvizz
By 2012, Facebook had reached one billion users, representing an unprecedented archive of human interaction. However, for academics, this data was locked behind a "walled garden." Unlike the open web, which could be easily indexed by crawlers, Facebook was a closed system.
Researchers faced a modular dilemma:
- In-house researchers had full access but lacked independence.
- Interface crawling was technically fragile and legally ambiguous.
- Surveys relied on what users said they did, rather than what they actually did.
Rieder’s insight was that the API (Application Programming Interface) could be repurposed as a research instrument. If marketing tools could use the API to track sentiment, scholars could use it to map the structural sociology of the platform.
Methodology: The API as a Research Instrument
Netvizz was developed as a PHP application that users (researchers or participants) authorized to read their data. The methodology centers on translating Facebook's internal data structures—nodes (users/posts) and edges (friendships/interactions)—into a format compatible with visualization toolkits like Gephi.
The Analytical Framework
The tool targets three distinct "spaces" within the Facebook ecosystem:
- Personal Networks: Mapping the "ego-network" to see how social circles (school, work, family) cluster.
- Groups: Analyzing interaction networks where nodes are members and edges are likes or comments within the group.
- Pages: Bipartite networks connecting users to the content they engage with.
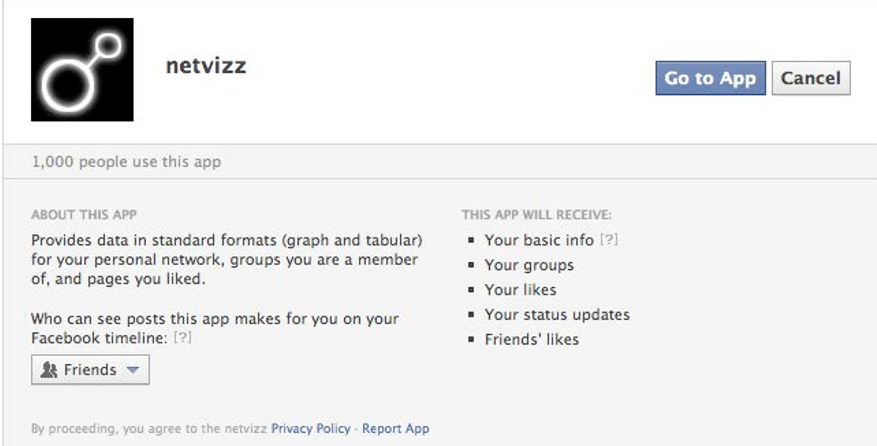 The data extraction starts with the permission dialogue, illustrating the ethical and technical gateway to the user's social graph.
Experiments: Identifying Radicalization and Engagement
Rieder illustrates the tool's power through two political case studies involving anti-Islam movements.
Case Study 1: The "Bridging" Leader
In the "Islam is Dangerous" group, Netvizz extracted 2,339 members. By calculating Betweenness Centrality, Rieder identified that the group's structure was not decentralized; rather, a single administrator acted as the "central bridger." This suggests that even seemingly organic social movements on Facebook are often structurally dependent on specific gatekeepers.
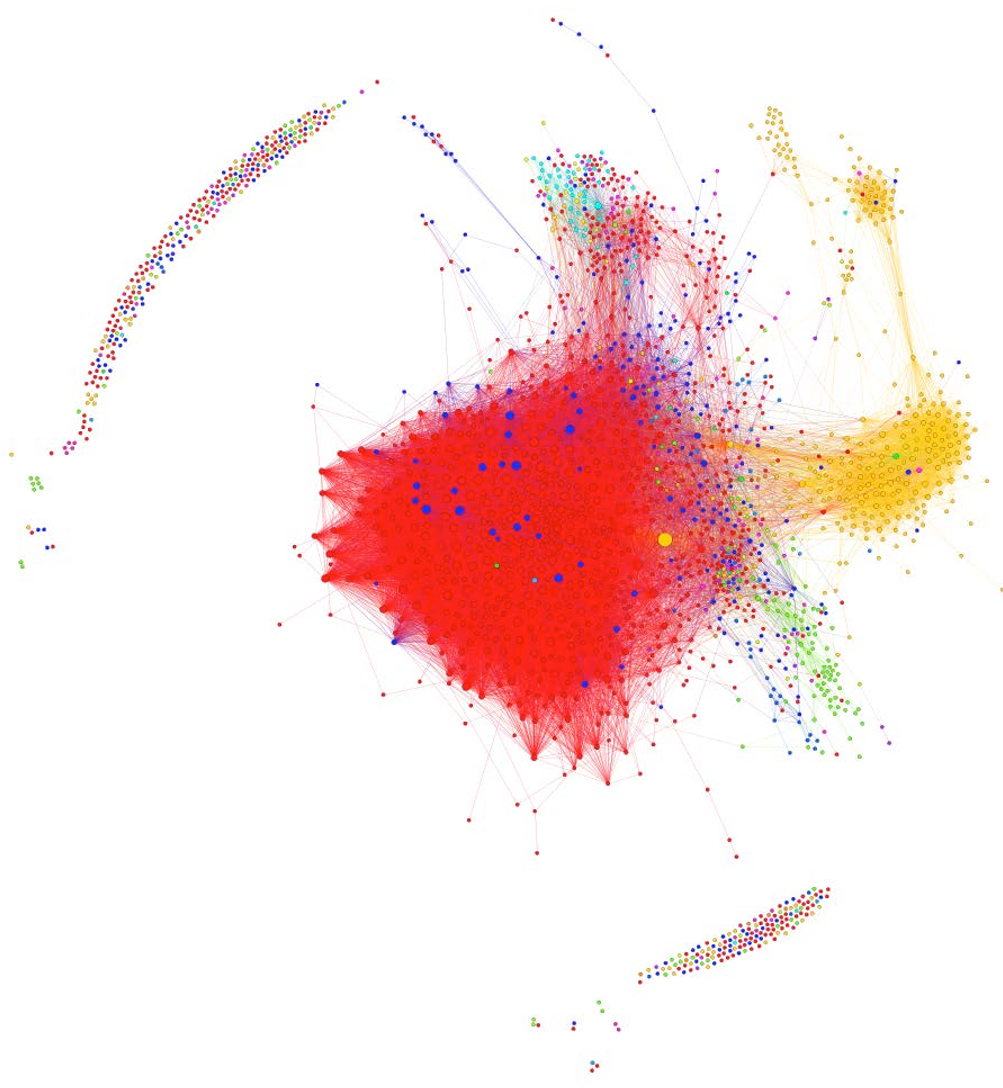 Graph metrics reveal leadership structures within Facebook groups, where red nodes indicate high control over information flow.
Case Study 2: Content vs. Engagement
By analyzing 200 posts from a specific page, Rieder found a clear correlation between media type and user behavior:
- Photos: High "Like" volume (low-effort engagement).
- Links: High "Comment" volume (high-effort, discursive engagement).
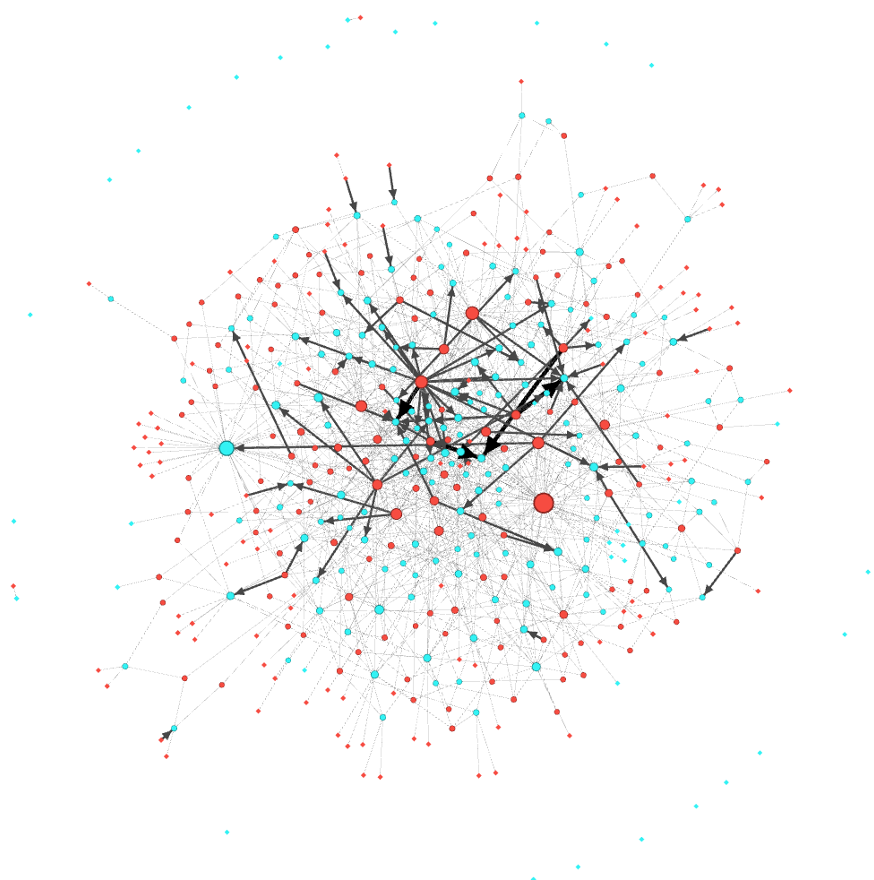 Statistical view of user interaction, showing how different content types evoke different social responses.
Critical Insight & Conclusion
The true value of Netvizz is not just in data gathering, but in its pedagogical role. By making network analysis visual and accessible, it invited qualitative researchers to engage with Post-Demographic analysis—studying people not by who they claim to be (age, gender), but by the cultural "traces" (likes, interactions) they leave behind.
Limitations: The paper honestly notes that the API is a "black box." An empty data field might mean the data doesn't exist, or it might mean a privacy setting blocked it. This technical ambiguity remains a challenge for digital methods.
Ultimately, Netvizz represents a pivotal moment in internet research history, where software development became a legitimate form of academic inquiry, allowing us to see the "social" in social media through the lens of graph theory.