
SVR vs. Linear Regression: Decoding Poverty Mapping in Vietnam
Comparing Support Vector Regression and Statistical Linear Regression for Predicting Poverty Incidence in Vietnam
This study evaluates the performance of Support Vector Regression (SVR) and Statistical Linear Regression (LR) for small-scale poverty mapping in Vietnam. Using the Foster-Greer-Thorbecke (FGT0) measure, the research identifies that Linear Regression with feature selection outperforms SVR in downscaling coarse training data to finer spatial units.
TL;DR
Accurate poverty maps are essential for meeting global development goals, yet they are often hindered by data scarcity. This study compares Support Vector Regression (SVR) and Linear Regression (LR) to predict poverty incidence in Vietnam. Surprisingly, the classic Linear Regression model significantly outperformed the machine learning approach, though both methods revealed a critical weakness: the failure to account for spatial autocorrelation.
The Challenge: Mapping Poverty Without Fieldwork
Poverty is a multidimensional phenomenon driven by a mix of biophysical factors (forest resources, land usability) and socio-economic variables (literacy, infrastructure). While the Small Area Estimation (SAE) method is a standard, it requires massive household data. The authors sought to determine if "off-the-shelf" data mining tools could simplify this process by training models on coarse data to predict poverty at finer spatial scales.
Methodology: Machine Learning vs. Statistics
The study utilized 12 driver variables, ranging from MODIS-derived forest cover to census-based electricity availability. The target metric was the FGT0 (Poverty Incidence).
The Contenders:
- SVR (Support Vector Regression): Utilizing a Radial Basis Function (RBF) kernel and a genetic algorithm for parameter tuning ( and ).
- Linear Regression (LR): Paired with a feature selection algorithm based on the Akaike Information Criterion (AIC) to eliminate collinearity.
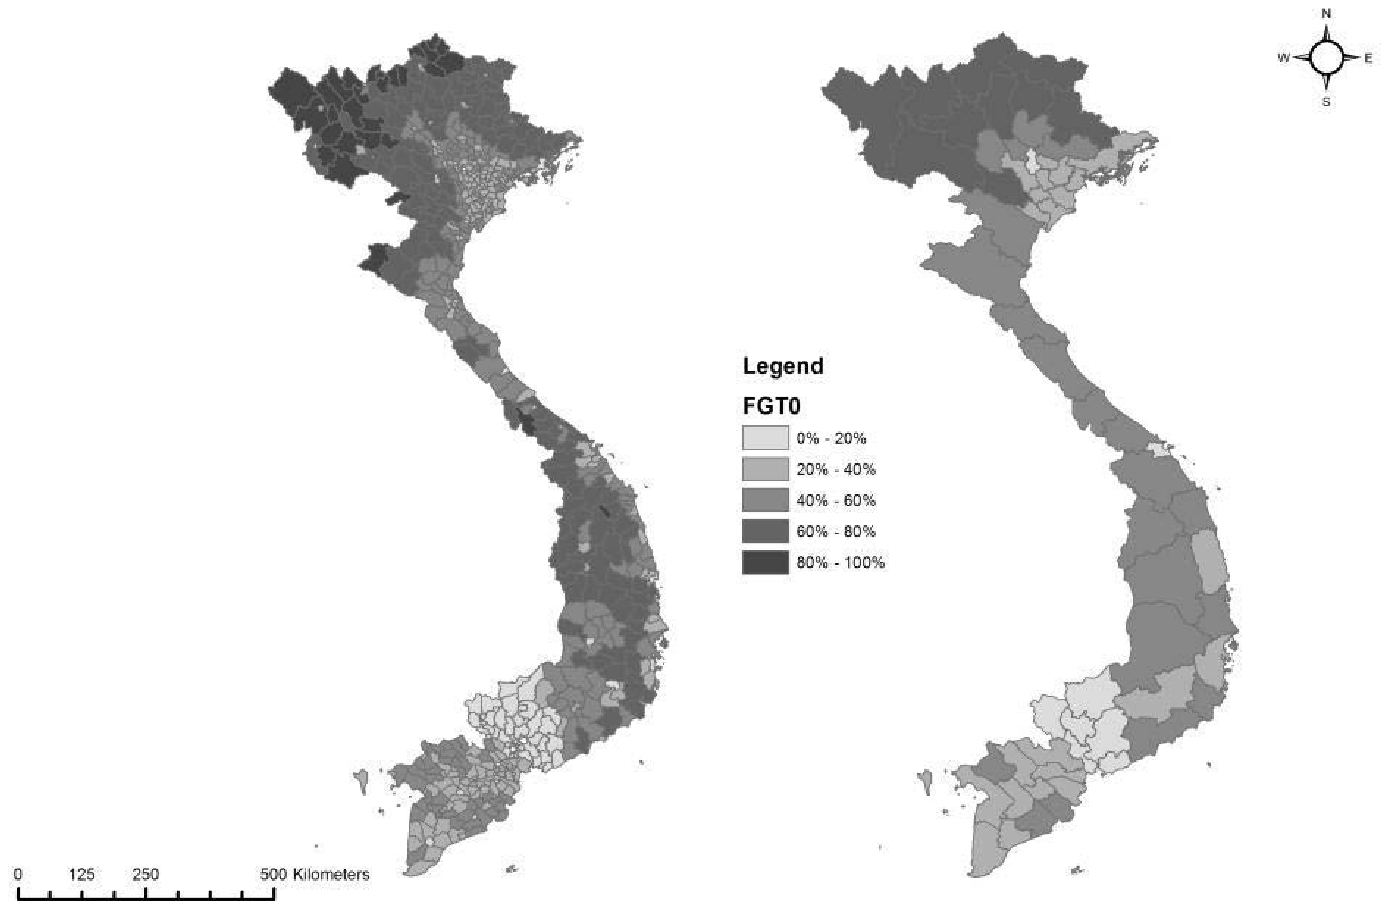 Fig 1. Spatial scale levels of the poverty data in Vietnam used for training and testing.
Experimental Results: The Statistical Advantage
The results were conclusive: Linear Regression won on almost every metric.
| Model | RMSE | Spearman Rho |
|---|---|---|
| Support Vector Regression (SVR) | 0.196 | 0.460 |
| Linear Regression (LR) | 0.115 | 0.835 |
Why did SVR struggle?
The authors suggest a "Learning Gap." In machine learning, the model is only as robust as its training set. In this case, the training data range (5%–80% poverty) was narrower than the testing data range (27%–93%). While SVR struggled to generalize outside its known bounds, the Linear Regression model flourished through extrapolation, albeit sometimes predicting impossible values (above 100% or below 0%).
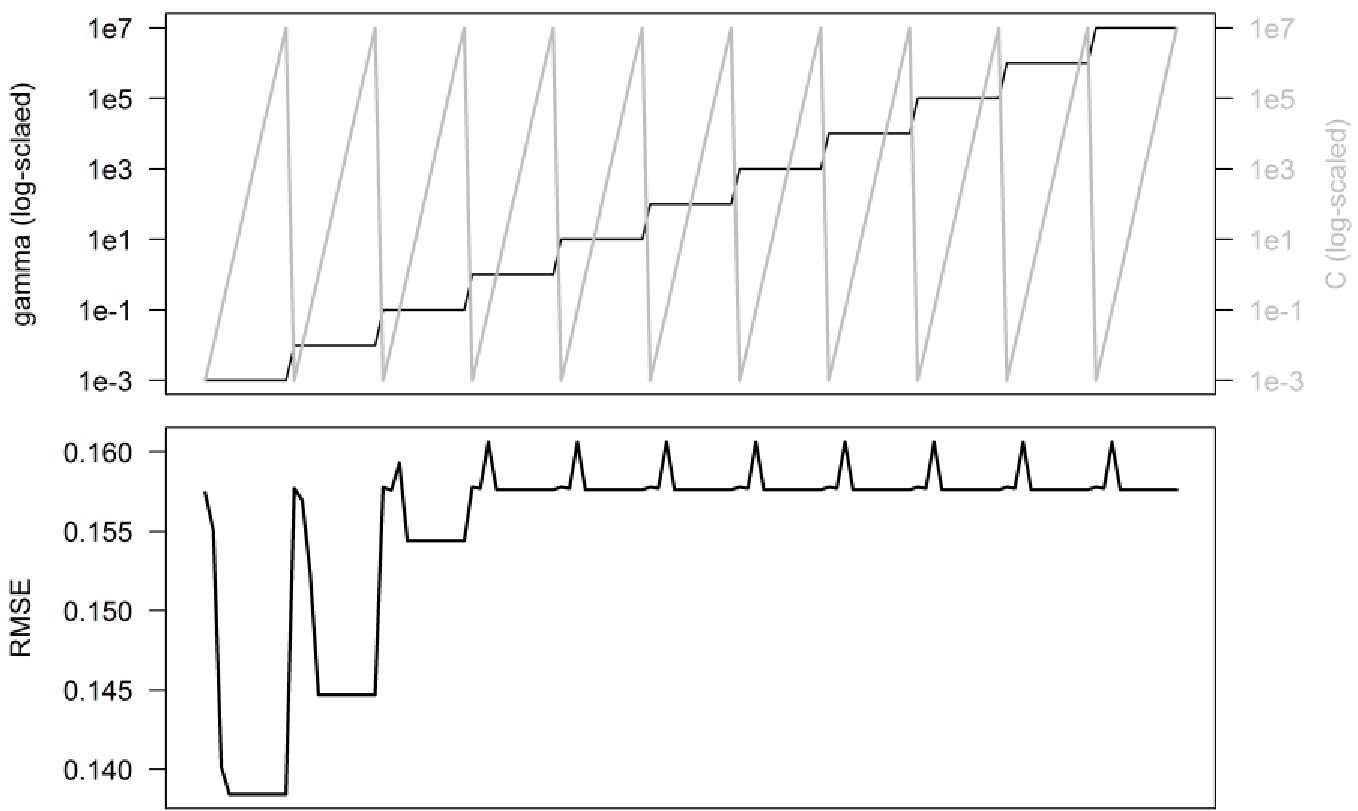 Fig 2. Parameter optimization for SVR showing the relationship between Gamma, C, and RMSE.
Critical Insight: The Spatial Factor
The most profound finding wasn't just which model won, but what both models missed. Both SVR and LR showed high Moran’s I values (0.638 and 0.672), meaning their errors were not random—they clustered spatially.
- SVR Errors: Clustered heavily in traditional poverty hotspots like the Northern and Central Highlands.
- LR Errors: Showed a more heterogeneous but still spatially dependent distribution.
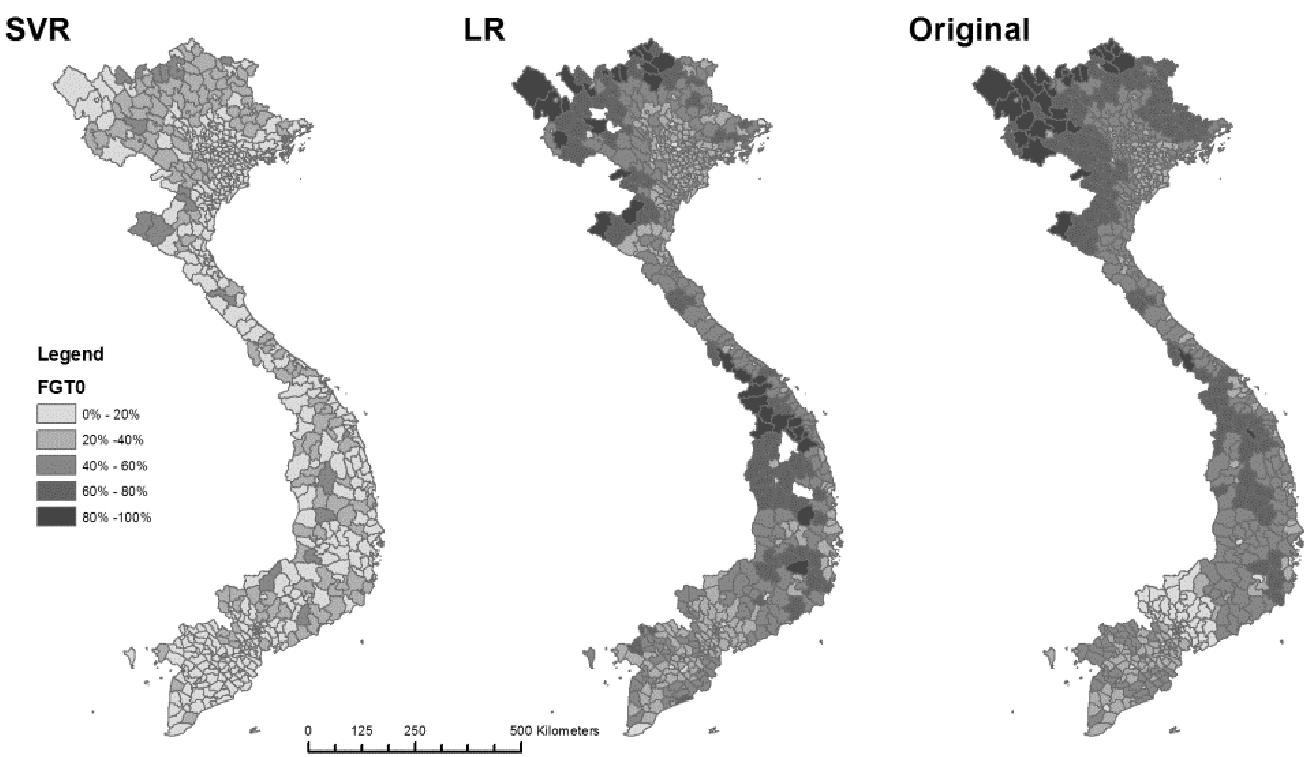 Fig 3. Residual maps showing spatial autocorrelation in both models.
Deep Insight & Conclusion
This paper serves as a reality check for the "AI-first" mindset. In domains like poverty mapping—where data is often sparse or non-representative—classic statistical models often provide better out-of-distribution performance due to their inherent mathematical assumptions.
Future Outlook: The high spatial autocorrelation in residuals suggests that the next generation of poverty models must move beyond "flat" regressions. Integrating Local Indicators of Spatial Association (LISA) or adopting Spatial Autoregressive Models will be the next frontier in turning data mining into a truly valuable tool for global development.
Takeaway for Researchers
- Don't discount LR: For small samples with extrapolation needs, LR remains a formidable baseline.
- Spatial is Special: When working with geographic data, standard cross-validation may hide spatial biases. Always test for autocorrelation in your residuals.