
SmartGrid: Predicting Retail Success Through the "Heartbeat" of Urban Social Data
Supporting Retail Business in Smart Cities using Urban Social Data Mining
The paper introduces a spatial data mining framework to predict the footfall evolution of new brick-and-mortar businesses using Foursquare check-in data as a proxy. The core method, the SmartGrid (SG) algorithm, dynamically clusters urban areas to identify relevant neighboring venues, achieving a prediction accuracy of 86% for new business popularity.
TL;DR
Choosing the right location for a physical store is no longer just about "location, location, location"—it's about data-driven neighborhood dynamics. This paper presents a novel approach using social network "check-ins" to forecast the popularity of new businesses. By introducing the SmartGrid (SG) algorithm, researchers achieved 86% accuracy in predicting business evolution by dynamically identifying how a shop's neighbors influence its success.
Problem & Motivation: The Static Data Trap
In the era of smart cities, why do we still rely on 1950s theories like Reilly’s Law of Retail Gravitation? Traditional retail planning depends on resident census data and manual sampling, both of which are notoriously "laggy" and expensive.
The authors argue that two major gaps exist in current research:
- Rigid Boundaries: Most models use fixed circles (e.g., "all shops within 500m") that ignore physical realities like rivers, parks, or city layout.
- Category Silos: Previous studies focused almost exclusively on restaurants. But in a real city, a gym next to a health-food store creates a synergy that single-category models miss.
Methodology: The "SmartGrid" Intuition
The researchers collected over 60 million check-in data points from Foursquare across two diverse European cities: Patras (Greece) and Oulu (Finland). Their goal was to predict a metric called avgCM (Average Check-ins per Day).
The SG Algorithm Workflow
The breakthrough lies in how the algorithm "sees" the city:
- Smart Tiles: Instead of a blind grid, it uses K-means clustering to segment the city based on actual venue density.
- Dynamic Sub-clustering: It utilizes an iterative version of DBSCAN. If a neighborhood is sparse, the algorithm expands its search; if it's dense (like a mall), it tightens its focus.
- Linear Regression Integration: It uses the relationship between venue count and cluster density to dynamically choose the number of sub-groups, ensuring the prediction is always based on a statistically relevant "peer group."
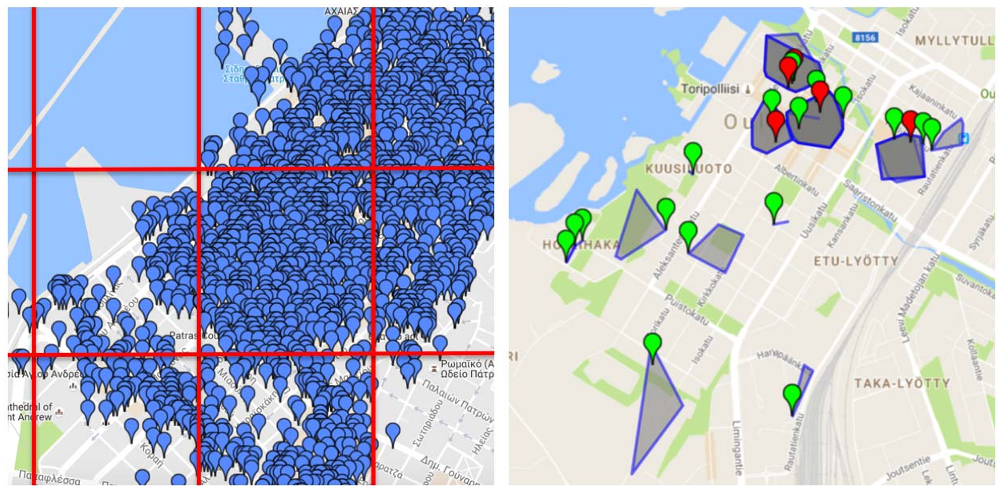 Fig 1: The SG algorithm (right) adapts to the actual distribution of venues, whereas the RG algorithm (left) creates arbitrary cuts that may ignore urban geography.
Experiments: Proving the Advantage
The study compared three approaches:
- EUA (Entire Urban Area): The baseline "naïve" model.
- RG (Rectangular Grid): A standard grid-based subdivision.
- SG (Smart Grid): The proposed adaptive model.
Key Findings
- Coverage: The EUA and RG models failed to provide predictions for many venues (up to 55% failure in sparse areas) because they couldn't find "enough" neighbors within their rigid constraints.
- Accuracy: SG reached a peak performance of 86% adjusted accuracy in Patras.
- Robustness: Even though Oulu and Patras have different climates and social habits, the SG algorithm's performance remained high, proving that urban mobility patterns follow universal mathematical laws regardless of geography.
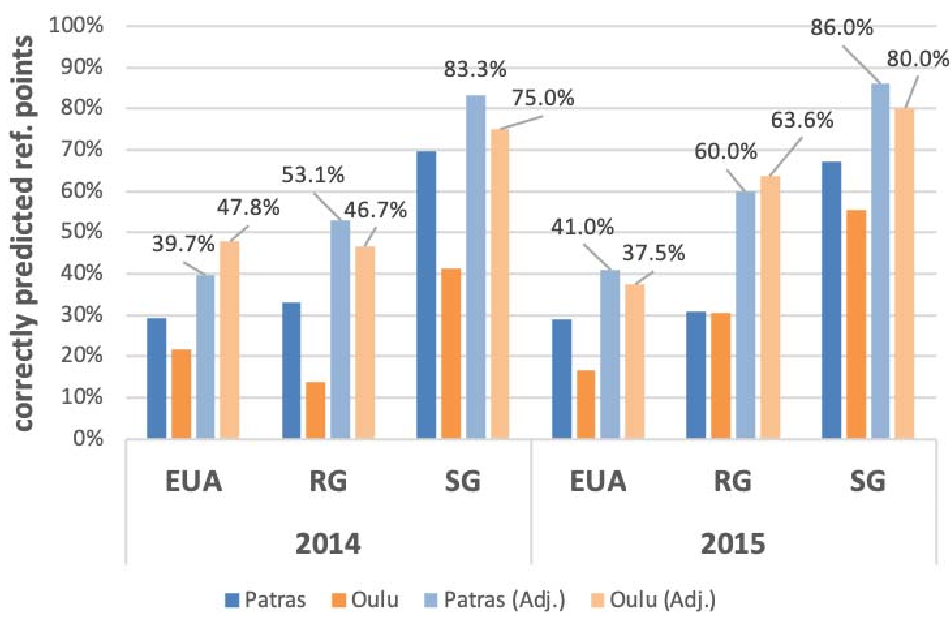 Fig 2: Comparison showing SG consistently outperforming other methods across all test years and cities.
Critical Insight & Conclusion
Why it works
The SG algorithm effectively captures the Inductive Bias of urban retail: businesses don't exist in a vacuum. A new shop’s success is a reflection of the "gravitational pull" already established by its neighbors. By allowing the neighborhood boundaries to be fluid and data-driven, the authors captured the true functional zones of the city.
Limitations
The study currently relies on Foursquare, which, while global, may have demographic biases (skewing toward younger, tech-savvy users). Furthermore, while check-ins are a strong proxy for success, they don't directly measure revenue.
The Future of Smart Retail
This research simplifies the complex "site selection" problem into a scalable API-based solution. For smart city planners and entrepreneurs, this means the ability to "stress-test" a business location before signing a lease, simply by mining the digital footprint of the surrounding streets.