
Navigating the SNA Toolscape: A Survey of Community Detection and Visualization
A Survey of Tools for Community Detection and Mining in Social Networks
This paper provides a comprehensive survey and comparative analysis of six prominent Social Network Analysis (SNA) tools—Pajek, NetMiner, Gephi, igraph, CFinder, and Visone—focusing on their capabilities in community structure detection and network visualization. It establishes a benchmark using the American College Football dataset to evaluate algorithmic efficiency and visualization quality across these platforms.
TL;DR
Social Network Analysis (SNA) has evolved from simple graph theory to a multi-disciplinary powerhouse used in marketing, biology, and sociology. This paper dives into six major tools—Pajek, NetMiner, Gephi, igraph, CFinder, and Visone—dissecting their strengths in uncovering communities (clusters) and visualizing complex link structures. The core finding? While GUI tools like Gephi win on aesthetics, the igraph library remains the undisputed heavyweight for scalable, professional-grade analysis.
Problem & Motivation: The "Community" Challenge
In an Online Social Network (OSN) like Facebook or LinkedIn, the "Community Structure" is where the most valuable insights live. A community is essentially a group of nodes that are more densely connected to each other than to the rest of the network.
The technical challenge lies in scale and diversity. Most modern networks are:
- Large-scale: Housing millions of actors and edges.
- Temporal: Relationships change over time.
- Multi-relational: Users might interact through different types of links (e.g., "following" vs. "messaging").
Existing tools often specialize in only one corner of this problem, leaving researchers with a fragmented workflow.
Methodology: Benchmarking the Giants
The authors categorized the tools based on their underlying philosophy. You have GUI-based packages (NetMiner, Gephi, Visone) designed for interactivity, and Scripting libraries (igraph, SNAP) built for extensibility and speed.
The Core Algorithms
The survey highlights several vital community detection approaches:
- Louvain Method: A greedy modularity optimization that excels at finding hierarchical structures.
- Edge Betweenness: A divisive approach that identifies "bridge" edges between communities and removes them.
- Clique Percolation Method (CPM): The unique engine of CFinder, designed to find overlapping communities where a single node belongs to multiple groups.
The Visualization Layouts
Visualizing a million nodes is a recipe for a "hairball" graph. The paper examines:
- Force-Directed (Spring) Layouts: (Fruchterman-Reingold) Nodes act like repelling magnets while edges act like springs.
- Circular & Tree Layouts: Useful for showing hierarchy and connectivity patterns.
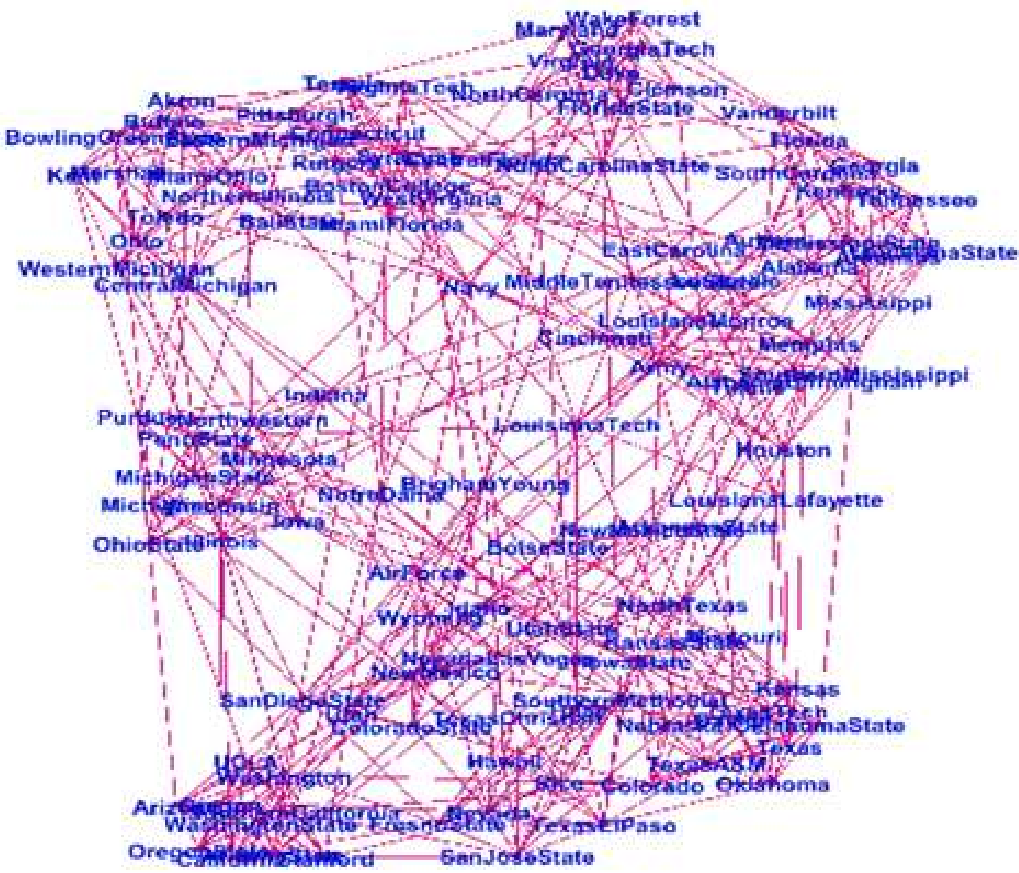 Figure 1: Visualization of the American College Football network using igraph with a Kamada-Kawai layout.
Experiments: The Football Dataset Test
To compare these tools fairly, the authors utilized the American College Football dataset (115 nodes, 613 edges).
Key Results:
- Accuracy: Both the Louvain method (Gephi) and Fast Greedy algorithm (igraph) successfully identified the 6 natural communities within the football conference structure.
- Capacity: Pajek and igraph demonstrated the capability to handle networks exceeding 1 million nodes, whereas Visone was limited to smaller scales.
- Versatility: igraph supports the most file formats (.gml, .graphml, .txt, .csv), ensuring high interoperability.
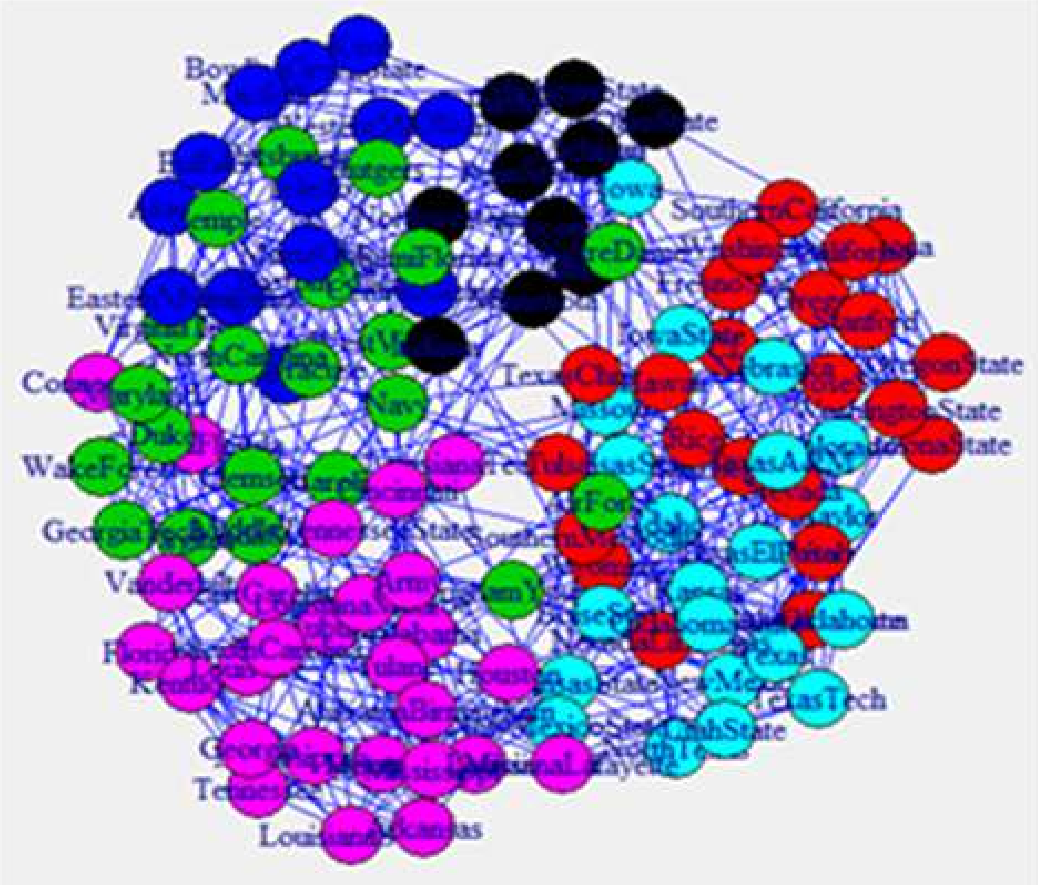 Figure 2: Community detection result in Gephi using the Louvain method, illustrating the identified clusters through color coding.
Critical Analysis & Conclusion
This paper serves as a high-level roadmap for researchers.
Takeaways:
- Best for Performance: igraph. Its ability to process millions of vertices with low execution time makes it the go-to for data scientists.
- Best for Visualization: Gephi. Its 3-D rendering engine and "Force Atlas" layouts provide the most intuitive visual exploration.
- Best for Niche Analysis: CFinder for overlapping communities and NetMiner for professional business-centric statistical reporting.
Limitations & Future Outlook:
The paper, published in 2016, does not cover the recent shift toward Graph Neural Networks (GNNs) and Deep Learning-based community detection which now dominate the SOTA in OSN mining. Additionally, the comparison on "computing time" was qualitative (Fast/Medium); a more rigorous quantitative time-complexity benchmark on synthetic graphs of varying densities would have provided deeper insights.
Future Work in this area will likely focus on real-time community detection in streaming data, a feature currently lacking in the surveyed static-analysis tools.