
Visual Analytics of Social Media: Bridging Human Intuition and Big Data Dynamics
A Survey on Visual Analytics of Social Media Data
This paper provides a comprehensive survey of visual analytics for social media data, focusing primarily on Twitter. It introduces a novel taxonomy that classifies existing research into two major categories: gathering information (keyword, topic, and multi-faceted approaches) and understanding user behaviors (social interactions and network content).
TL;DR
Social media data is a chaotic goldmine of human dynamics. This seminal survey by Wu et al. outlines how Visual Analytics (VA) serves as the crucial bridge between raw, noisy social streams and actionable insights. By categorizing the field into Information Gathering and Behavior Understanding, the authors show how interactive "Human-in-the-loop" systems are outperforming purely automated methods in solving the challenges of information overload and social complexity.
Problem: The "Big Data" Paradox in Social Networks
While platforms like Twitter generate over 500 million messages daily, the sheer volume, velocity, and variety of this data create a paradox: we have more information than ever, but less ability to trust or understand it.
- Heterogeneity: Mixing text, geo-tags, images, and network links.
- Noise: High proportions of spam and irrelevant content.
- Dynamism: Information spreads and evolves in seconds, making static analysis obsolete.
Traditional data mining often treats these as cold numbers, losing the "why" behind human behavior. Visual Analytics aims to fix this by putting the expert back in the driver's seat.
Methodology: The Taxonomy of Social Intelligence
The paper introduces a unified framework to categorize how we "see" social data:
1. Gathering Information (The "What")
- Keyword-based: High-speed filtering for specific events (e.g., Visual Backchannel).
- Topic-based: Using models like LDA to group messages into semantic clusters (e.g., ScatterBlogs).
- Multi-faceted: Combining the "4 Ws" (Who, What, When, Where) to provide situational awareness during crises.
2. Understanding User Behaviors (The "Why")
This is the "meat" of the research, focusing on how users interact.
- Information Propagation: How does a rumor spread? Systems like Whisper use a sunflower metaphor to track retweets in real-time.
- Social Coopetition: Visualizing how topics compete for public attention using flow-style visualizations.
- Ego-centric Analysis: Creating "behavioral portraits" of individual users to identify bots or influencers.
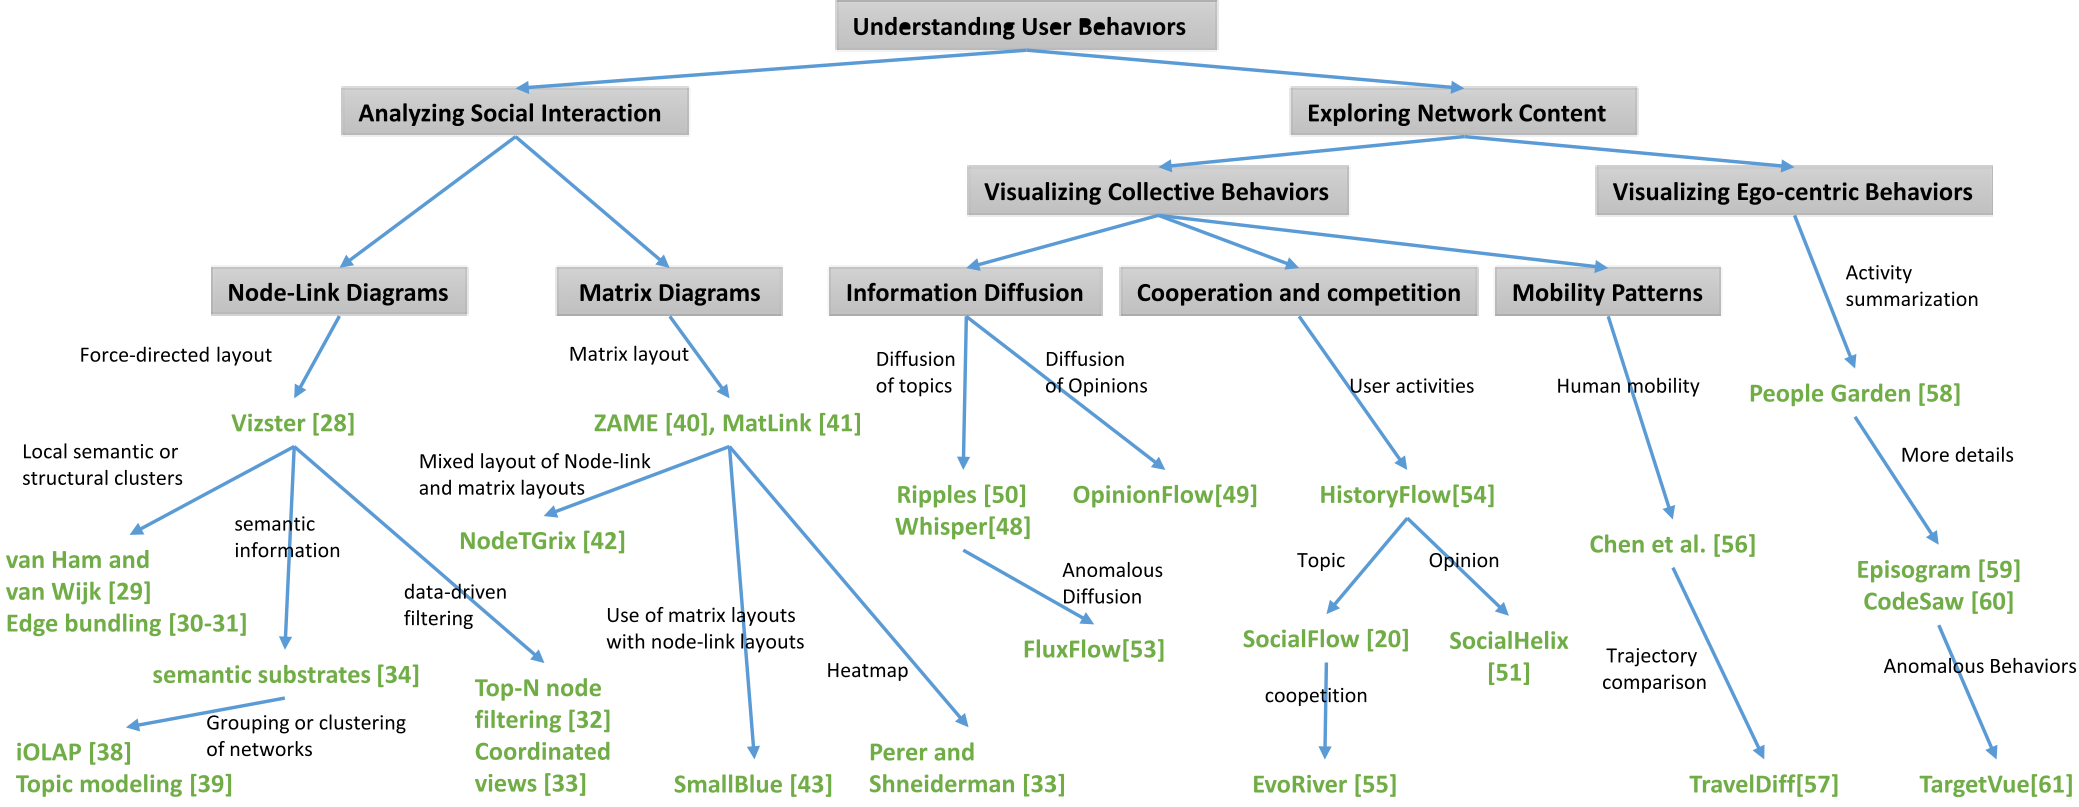 Figure 1: The established taxonomy for social media visual analytics, dividing the field into information gathering and behavior exploration.
Key Methodology Spotlight: Information Diffusion
One of the most impressive feats discussed is the visualization of Information Diffusion. Purely mathematical models often fail to capture the "community response." Systems like Whisper (Figure 2) use spatiotemporal mapping to show how a single tweet triggers a global response. This isn't just a map; it's a dynamic representation of social influence, highlighting "opinion leaders" who act as bridge nodes between distinct communities.
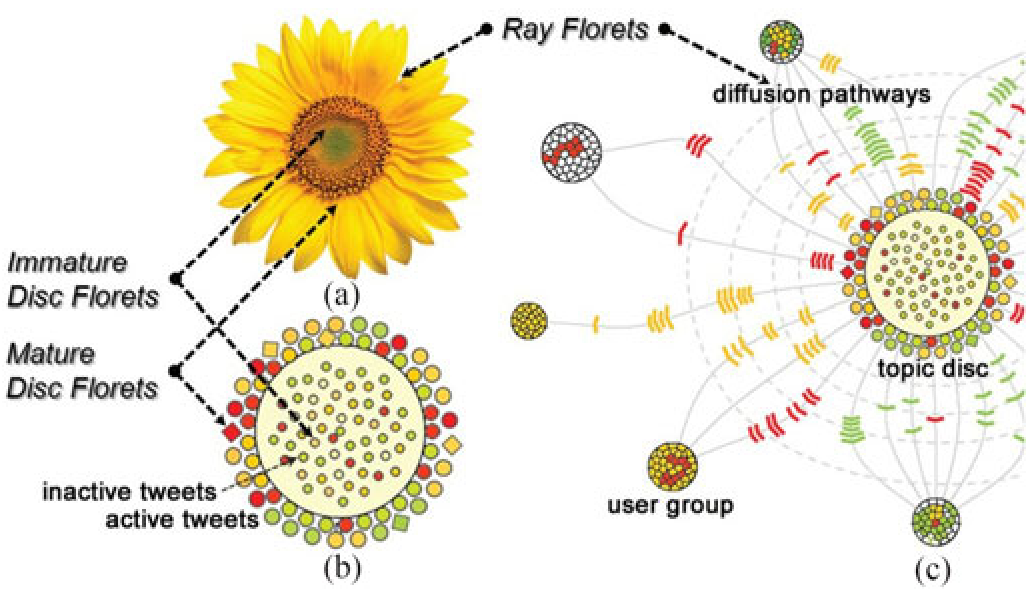 Figure 2: The Whisper system tracking how information "pulses" through a network over time and space.
Deep Insights: Beyond Simple Graphs
The paper emphasizes that Node-Link diagrams (the "hairball" effect) are no longer sufficient. The SOTA has moved toward Hybrid Representations like NodeTrix, which combines adjacency matrices (for high-density clusters) with traditional links (for overall structure).
Furthermore, the rise of Anomalous Behavior Detection (e.g., FluxFlow) shows that VA is now a defensive tool. By visualizing "outlier" retweet patterns, analysts can spot coordinated bot attacks or rumors before they go viral.
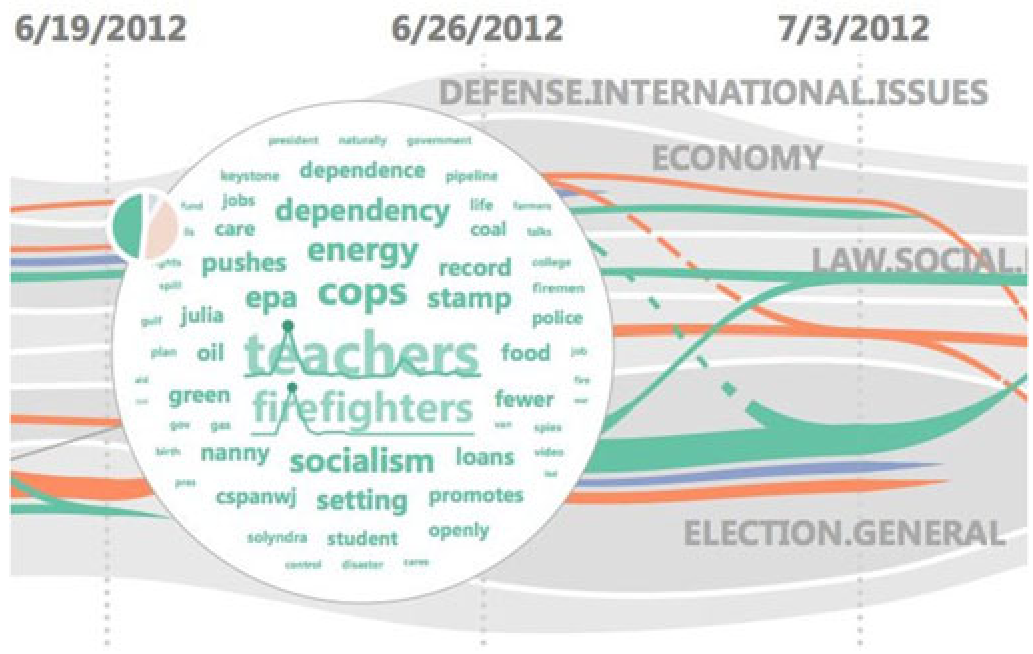 Figure 3: FluxFlow uses temporal circle packing to expose the visual signature of rumors vs. legitimate news.
Critical Analysis & Future Directions
Wu et al. conclude with a sobering look at the challenges ahead:
- Scalability: Billions of users cannot be rendered in real-time without massive breakthroughs in streaming visualization.
- Trust & Uncertainty: How do we visualize that a sentiment analysis score might be "only 60% certain"?
- Multi-modality: Social media is becoming more visual (TikTok, Instagram). Future VA must treat images and videos as first-class citizens, not just text attachments.
Conclusion
This survey is an essential map for any researcher entering the field of Computational Social Science. It argues convincingly that the future of social media analysis isn't just "smarter algorithms," but smarter interfaces that allow humans to filter the noise and find the signal in the chaos of global conversation.