
Bridging Digital Traces and Surveys: A New Blueprint for Epidemic Modeling
Synthesizing Social Proximity Networks by Combining Subjective Surveys with Digital Traces
The paper proposes a novel methodology for synthesizing high-fidelity social proximity networks by combining subjective survey data (schedules/enrollment) with digital trace data from wireless sensors. It develops a library of "in-class templates" from sensor data to refine large-scale epidemic simulations, specifically focusing on US high schools.
TL;DR
Researchers have developed a hybrid methodology to create ultra-realistic high school contact networks. By combining the "ground truth" precision of wireless sensor data (digital traces) with the broad reach of school surveys, they've created a scalable way to simulate how diseases spread in classrooms. The key finding? Traditional random graph models (like G(n,p)) significantly underestimate the effectiveness of targeted health interventions.
Background: The Fidelity Gap
In epidemic modeling, the "micro-network"—the specific way students interact in a classroom—is the engine of transmission. For years, scientists faced a binary choice:
- Subjective Surveys: Inexpensive but prone to human error and lacking technical "proximity" detail.
- Digital Traces (RFID/Motes): Extremely accurate but expensive and hard to scale to every school in a country.
This paper bridges this gap by introducing In-Class Templates.
The Methodology: Extracting the "Classroom DNA"
The authors treat the school day as a signal processing problem. They use a greedy algorithm to identify "Class Intervals" based on the density of long-duration Close Proximity Interactions (CPIs). Since they lacked actual schedules for the digital trace data, they used Community Detection (modularity maximization) to isolate individual classrooms within the massive web of wireless signals.
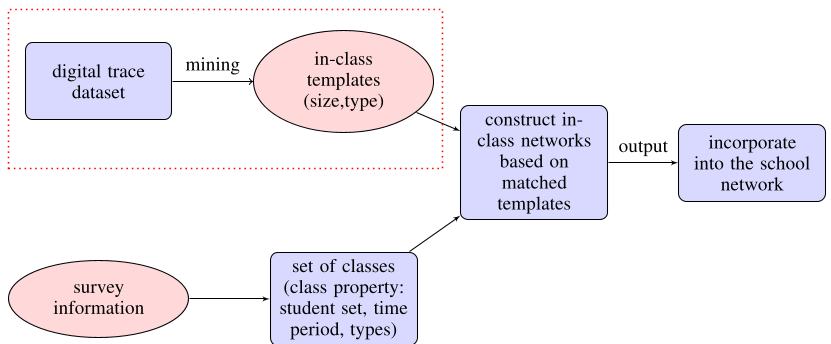 Fig 1: The hybrid workflow—Digital trace data creates the library, while surveys provide the specific schedule for deployment.
By filtering out "noise" (short contacts between adjacent rooms), they retrieved clean templates of how students actually cluster. They found that real classes aren't just random groups of people; they are highly clustered "clique-like" structures where contact durations follow a heavy-tail distribution.
Why Random Graphs Fail
A common practice in epidemiology is to use G(n,p) or Chung-Lu models to fill in the blanks of a classroom. This paper puts those models to the test.
While a G(n,p) model can be tuned to show a similar "attack rate" (total people infected) as real data, it fails miserably when we try to simulate Interventions.
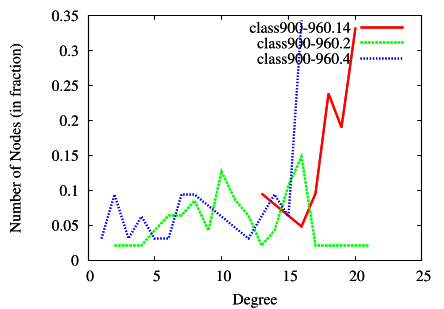 Fig 2: Real in-class networks (a, b, c) show intense local clustering that random models (G(n,p)) fail to replicate.
In the authors' simulation, they vaccinated the top 10% of "highly connected" students. On a digital trace network, this had a distinct impact on the epidemic's peak day. On a G(n,p) network, the result was statistically different. This is because Clustering Coefficient and Spectral Gap—mathematical measures of how "connected" a network is—differ wildly between real human behavior and mathematical randomness.
Results & Insights
- Complexity Matters: Real classroom contacts are not uniform. Most contacts are short, but a few "power users" maintain long-duration proximity.
- Calibration is Key: If researchers must use theoretical graphs (like Chung-Lu), they must tune them using parameters derived from real digital traces (degree distribution and edge weight) to be useful for policy.
- Generalizability: This method allows a researcher to take a digital trace "library" from one school and apply it to thousands of others using just their enrollment lists.
Conclusion: A Data-Driven Shield
The study proves that "close proximity" is more nuanced than just being in the same room. The internal structure of a classroom—the cliques, the seating, and the duration of interaction—dictates how a virus moves. By using digital trace templates, public health officials can move away from "one-size-fits-all" models toward high-fidelity simulations that accurately predict the success of vaccinations or social distancing.
Limitations: The study assumes in-class contact patterns are consistent across schools in the same country. Future work will need to verify if "PE classes" in Virginia look the same as as "PE classes" in California.