
Tabletop Community: Bridging Physical Interaction and Digital Social Graphing
Tabletop community: artwork for visualization of social interactions using a bipartite network
"Tabletop Community" is an interactive art installation that records and visualizes social interactions among users around a physical table. Utilizing RFID-embedded IC cards and an omni-directional camera, the system constructs a bipartite network graph to represent the evolving social fabric of the participants.
TL;DR
"Tabletop Community" is an innovative art-tech hybrid that captures real-world social encounters and transforms them into an interactive digital map. By combining RFID tracking with 360-degree panoramic photography, the system allows users to see themselves as part of a larger, evolving bipartite network, fostering a unique sense of group belonging and self-reflection.
Motivation: From Fleeting Moments to Persistent Networks
In the realm of public interactive art, the "moment of interaction" is often lost once the visitor leaves. While previous works like Remote Furniture explored physical touch across distances, they lacked a mechanism for visitors to see the "big picture" of the community they were joining.
The authors identified a critical gap: standard social network visualizations are often too abstract. Users see dots and lines but lose the physical context (who was I with? what was the vibe?). "Tabletop Community" was designed to anchor these digital nodes in physical reality, using a table as the social hearth.
Methodology: The Bipartite Network and Spring Layouts
The system architecture treats a social encounter as a specific event in time and space.
- The Hardware: A circular table equipped with an omni-directional camera, several RFID card readers, and an LCD monitor.
- The Bipartite Approach: Instead of simple person-to-person links, the authors used two types of nodes:
- User Nodes: Tied to a temporary IC card ID.
- Scene Nodes: Representing a specific interaction event, visualized by a panoramic photo.
- The Rotating Spring Model: To solve the visualization clutter, they employed a spring-based layout. Crucially, they developed a "rotating" model where the panoramic image in a Scene Node automatically rotates to face the User Node being inspected, creating a seamless transition from a global view to an egocentric perspective.
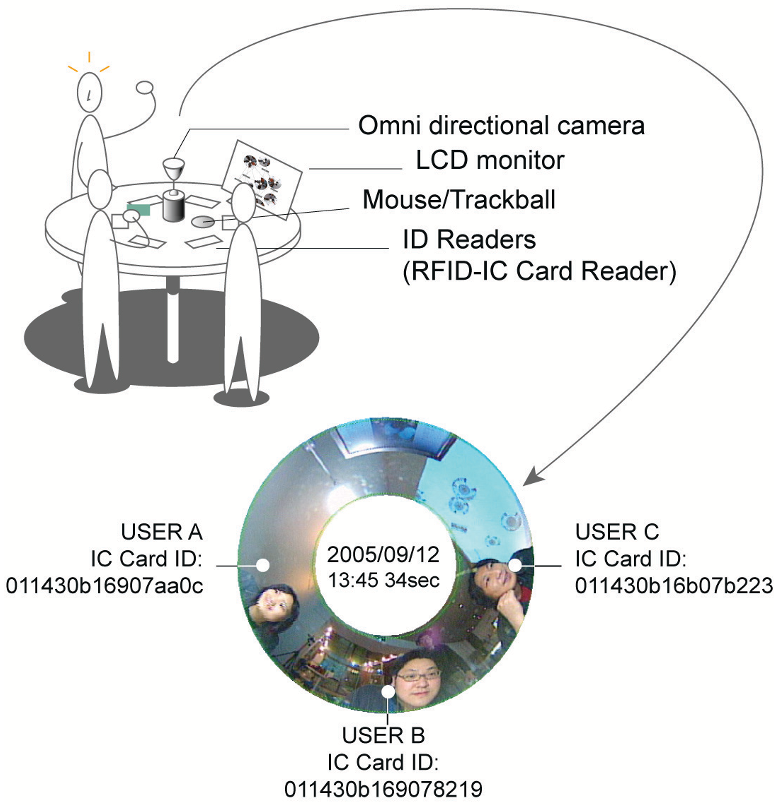 Above: The system configuration showing the interaction loop between physical card placement and real-time visualization.
Experiments and Community Feedback
The deployment at Ubicomp2005 served as a large-scale stress test. With 141 users and over 800 interactions, the system proved robust. The data revealed different "tiers" of interaction:
- Direct Interaction: Posing for the 360-degree camera.
- Secondary Interaction: Users teaching others how to use the system.
- Meta-Interaction: Groups standing around the screen to discuss their place in the resulting social graph.
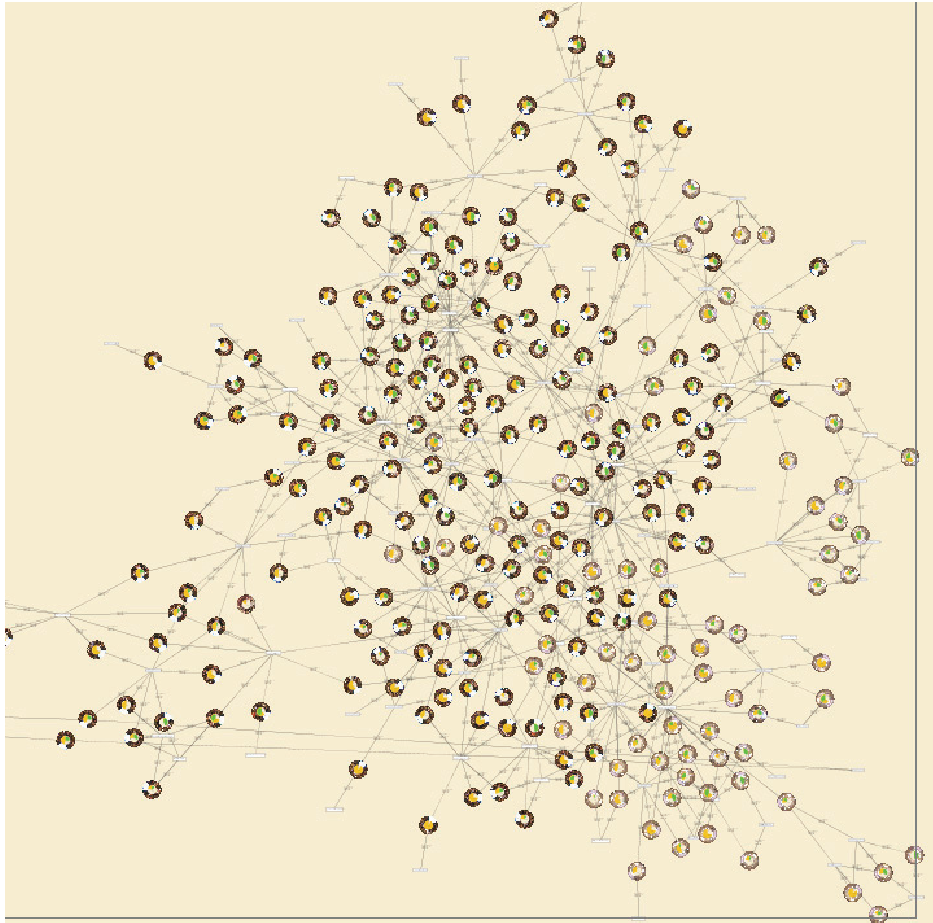 Above: The final visualization of the community over three days, illustrating the high density of connections mediated by the table.
Critical Analysis: Privacy vs. Participation
The most fascinating outcome of this study was the tension between data utility and privacy. While users loved seeing "indirect connections" (friends of friends), some were uncomfortable with facial recognition in a public venue.
To pivot, the authors explored the "Shake-hands table". By focusing on the gesture of a handshake rather than the face, they maintained the "humanity" of the record while lowering the psychological barrier to participation. This suggests that for future Smart Cities and ubiquitous computing, contextual gestures might be a more ethical "social signature" than biometrics.
Conclusion
"Tabletop Community" successfully transitioned from a mere art piece to a sociological tool. It demonstrates that social networks are not just digital constructs found on platforms like LinkedIn or X, but are living, breathing entities rooted in physical spaces. The use of a bipartite graph to include "scenes" as first-class citizens in a network remains a powerful design pattern for any developer building community-tracking software today.