
Unmasking Urban Socioeconomics: Why Your "Check-ins" Are Better Than Census Surveys
Telematics and informatics
The paper investigates the relationship between Point-of-Interest (POI)-related human mobility and urban socioeconomic indicators using Foursquare check-in data. By analyzing the category attributes of visited locations (e.g., restaurants vs. residences), the authors propose a Multi-Task Learning (MTL) framework to predict city-level household income, unemployment, and uninsured rates, achieving state-of-the-art predictive performance.
TL;DR
Researchers have moved beyond just where we go to what we are doing. By analyzing Foursquare check-in categories (POIs) across 51 US cities, this study demonstrates that our social activities—eating out vs. staying home—are deeply intertwined with a city's economic health. Using a Multi-Task Learning (MTL) framework, the authors can now predict household income and unemployment rates with over 84% accuracy, outperforming traditional models by leveraging the hidden correlations between different economic indicators.
Problem & Motivation: The "Where" vs. "What" Gap
For years, "Big Data" in urban planning meant looking at GPS traces to see how far or how often people moved. While volume and diversity are useful, they are semantically blind. They can't distinguish between a trip to a luxury restaurant and a trip to a local grocery store.
The authors' core insight is simple: The purpose of movement (the POI category) is a more powerful socioeconomic signal than the movement itself. Furthermore, they argue that socioeconomic indicators like "Income" and "Unemployment" are not independent—they are siblings. To predict one accurately, a model should look at the others simultaneously.
Methodology: Decoding the Urban Pulse
The research team utilized 3.1 million check-ins across 9 main categories and 291 sub-categories. They discovered fascinating correlations:
- The Food Signal: "Food" venues (improved consumption) are positively correlated with a city’s median income, while "Residence" (staying home) is a negative indicator.
- The Unemployment Rhythms: High check-ins at "Diners" correlate with unemployment, whereas "Breakfast Spots" correlate with higher employment—likely because job-holders are active early in the morning.
The Multi-Task Prediction Framework
Instead of building three separate models, the authors built one unified engine. They employed two feature selection strategies (S1 for shared features, S2 for task-specific ones) and fed them into three MTL architectures:
- Multi-task Lasso: Encourages overall feature sparsity.
- Multi-task L2,1: Promotes "group sparsity," assuming certain categories affect all indicators equally.
- The Dirty Model: The most sophisticated approach, which decomposes the model into a shared component (what indicators have in common) and a sparse component (what makes "Unemployment" unique from "Income").
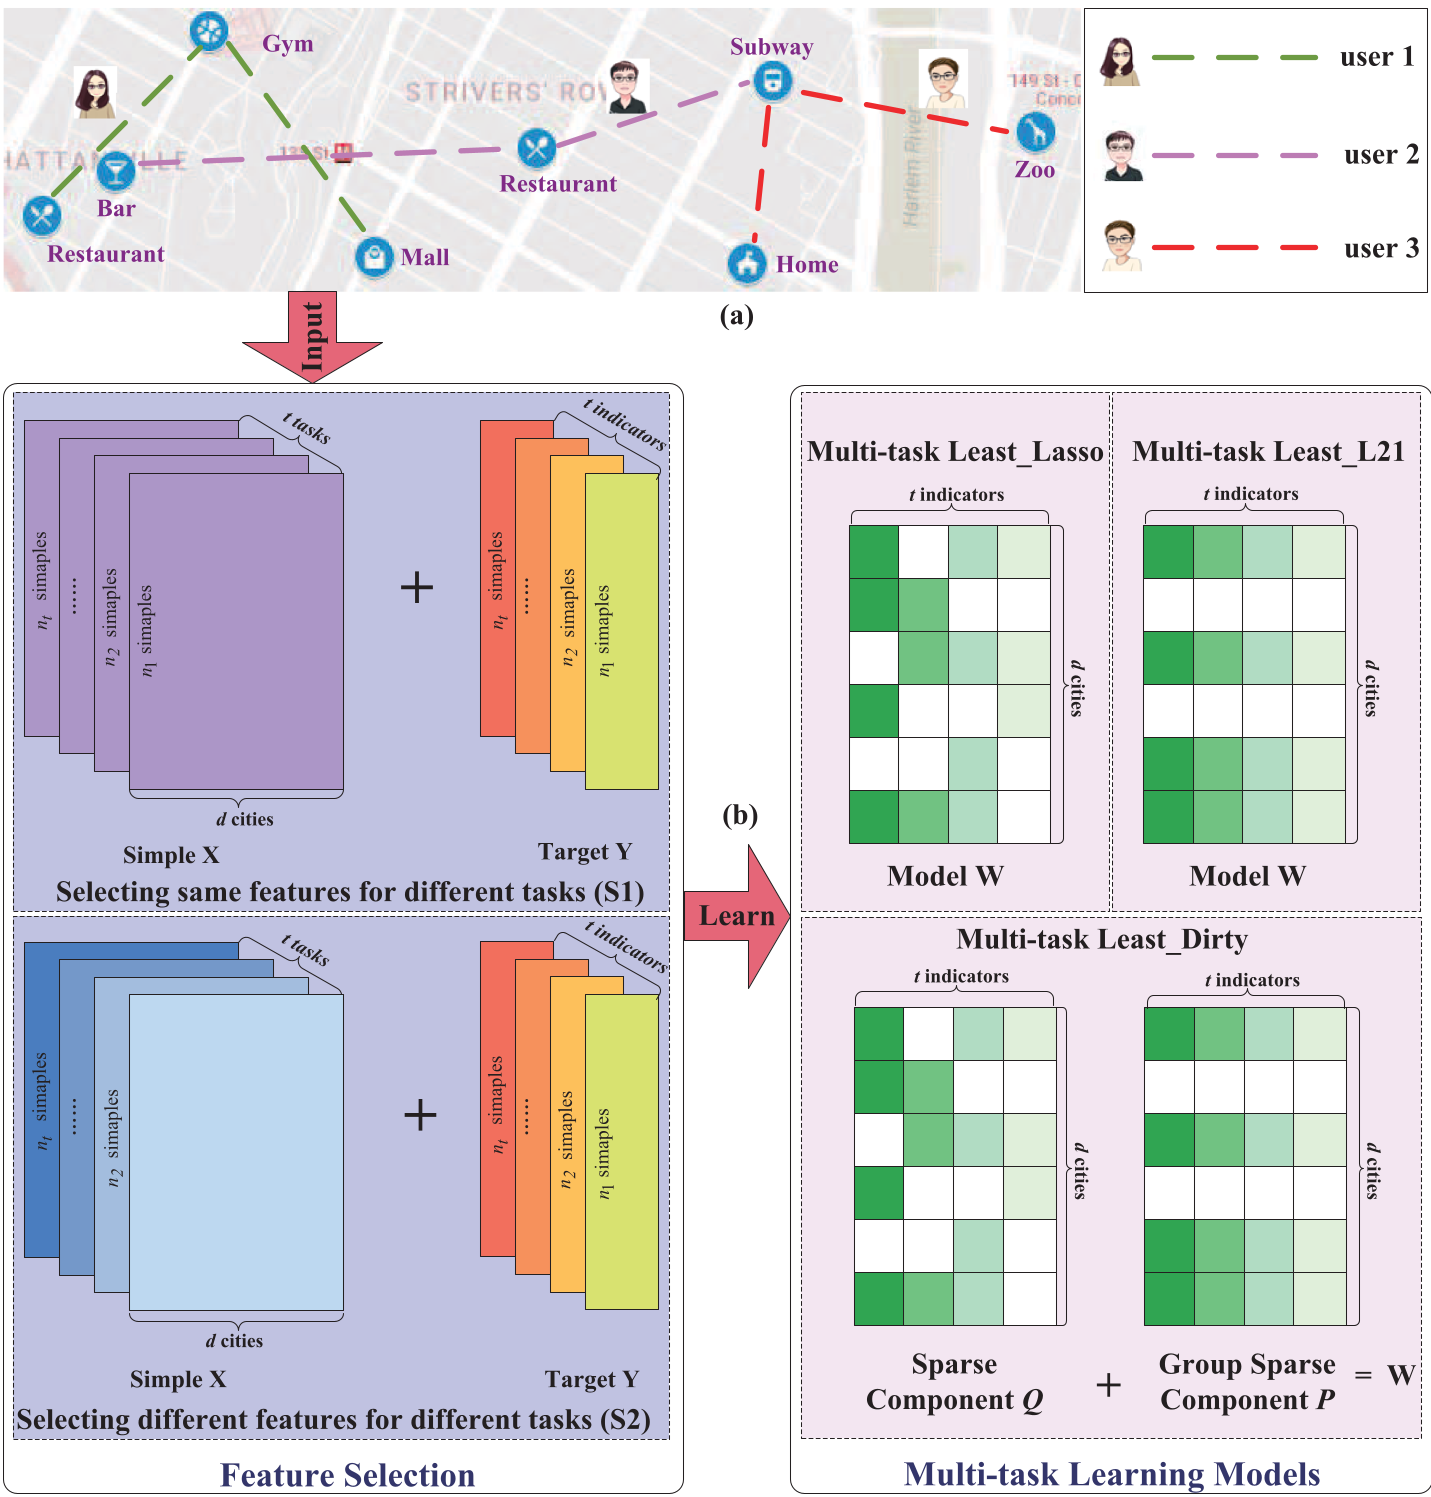 Fig 1: The Multi-task framework showing the pipeline from POI data to feature selection and MTL modeling.
Experiments: Superior Predictive Power
The results were striking. The MTL models didn't just beat the baseline; they crushed it. In terms of Pearson Correlation Coefficient (PCC), the MTL models reached 0.876 for unemployment.
Comparing the Single-Task Model (Red) to MTL (Blue/Green/Black) in the charts below shows that MTL is not only more accurate but also more stable as you increase the number of features. Traditional regression starts to fluctuate wildly (overfitting), while MTL remains robust by "regularizing" through shared knowledge.
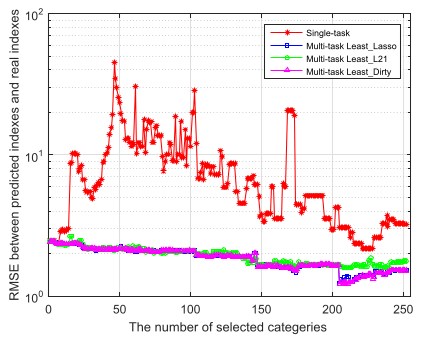 Fig 2: RMSE and PCC performance. Notice how the red line (Single-task) exhibits much higher volatility and lower accuracy compared to the MTL variants.
Critical Insight & Conclusion
Takeaway
The takeaway for urban scientists and policy makers is clear: Mobility is a social fingerprint. By monitoring POI-related behavior, we can obtain socioeconomic insights with the accuracy of a government survey but at a fraction of the cost and in near real-time.
Limitations & Future Work
The study relies on Foursquare data, which has a known user bias (skewing younger and more tech-savvy). However, the authors argue their framework is "data-agnostic." Future research could plug in "GPS movement" data from ride-hailing apps or mobile carriers, mapping coordinates to Google Maps categories to achieve even broader demographic coverage.
Ultimately, this work proves that in the age of Big Data, our collective movements are a mirror reflecting the hidden economic reality of our cities.