
MoodBook: Decoding the Digital Pulse of Conflict Zones
Telematics and informatics
This study presents a comparative emotion analysis of Facebook users in conflicting (Kashmir) versus non-conflicting (Delhi) regions. By developing a specialized lexicon called MoodBook—an extension of EmoLex—and utilizing K-means clustering, the researchers demonstrate that geopolitical stability significantly dictates the digital emotional footprint of netizens.
TL;DR
Can a Facebook post reveal the psychological toll of living in a conflict zone? This study proves it can. By analyzing 11,000+ posts from users in Kashmir (conflicting) and Delhi (non-conflicting), researchers developed MoodBook, a tool that identifies a stark "emotional rift": Kashmiris express significantly higher levels of anger and fear, while Delhites dominate the "Joy" spectrum.
Perspective: Why Geography Dictates Our Digital Subconscious
While we often view social media as a global village, our "digital walls" are deeply tethered to our physical reality. The authors argue that environmental factors—political unrest, violence, and restricted freedoms—act as an Inductive Bias for our emotional expression. This paper shifts the focus from simple sentiment polarity (Positive vs. Negative) to a multi-dimensional psychological state analysis.
Methodology: The Anatomy of MoodBook
The core innovation lies in the MoodBook lexicon. Recognizing that standard dictionaries like EmoLex miss regional nuances, the authors appended 1,000 new words, including:
- Cultural Context: Terms like Allah, Mandir, Eid, and Diwali.
- Slang/Abbreviations: lol, rofl, bff.
- Conflict Specifics: Words related to clashes, shutdowns, and protests.
The Mood-Vector Transformation
Each user is represented not by a single score, but by an 8-dimensional Mood-Vector:
mv = [fear, anger, sad, joy, surprise, disgust, trust, anticipation]
 (Formula: Calculating the fractional intensity of each emotion per user)
The "Emotional Rift": Kashmir vs. Delhi
The findings provide empirical evidence for what sociologists have long suspected:
- The Negativity Gap: Kashmiris displayed ~41% negative sentiment compared to Delhi’s ~31%.
- The Dominant Emotions: In Kashmir, Anger (19%) was the second most prevalent emotion, nearly ten times higher than in Delhi (2%).
- The "Trust" Anomaly: Interestingly, "Trust" was higher in Kashmir. Manual review showed this was linked to words like brotherhood, justice, and unite—reflecting a collective hope for peace amidst siege.
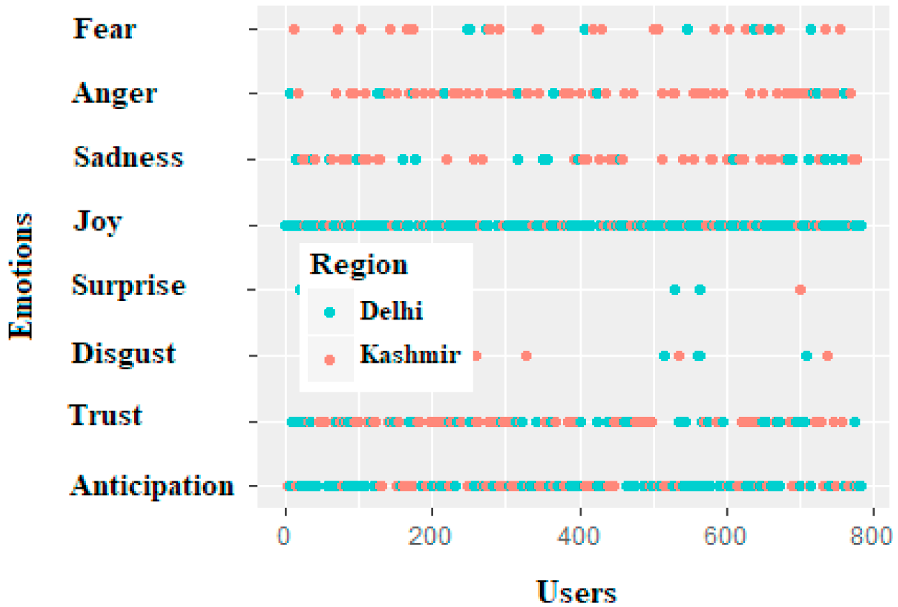 Fig 3: The scatter plot clearly delineates how Delhi users (Normal) gravitate toward Joy/Anticipation, while Kashmir users (Disturbed) cluster around Fear/Anger/Sadness.
Clustering the Human Psyche
Using K-means clustering (k=5), the study found that users naturally grouped by their region based solely on their emotions.
- Clusters 1 & 2 (The "Kashmir" groups) showed high centroids for Fear and Sadness.
- Clusters 3, 4, & 5 (The "Delhi" groups) showed high centroids for Joy and Anticipation.
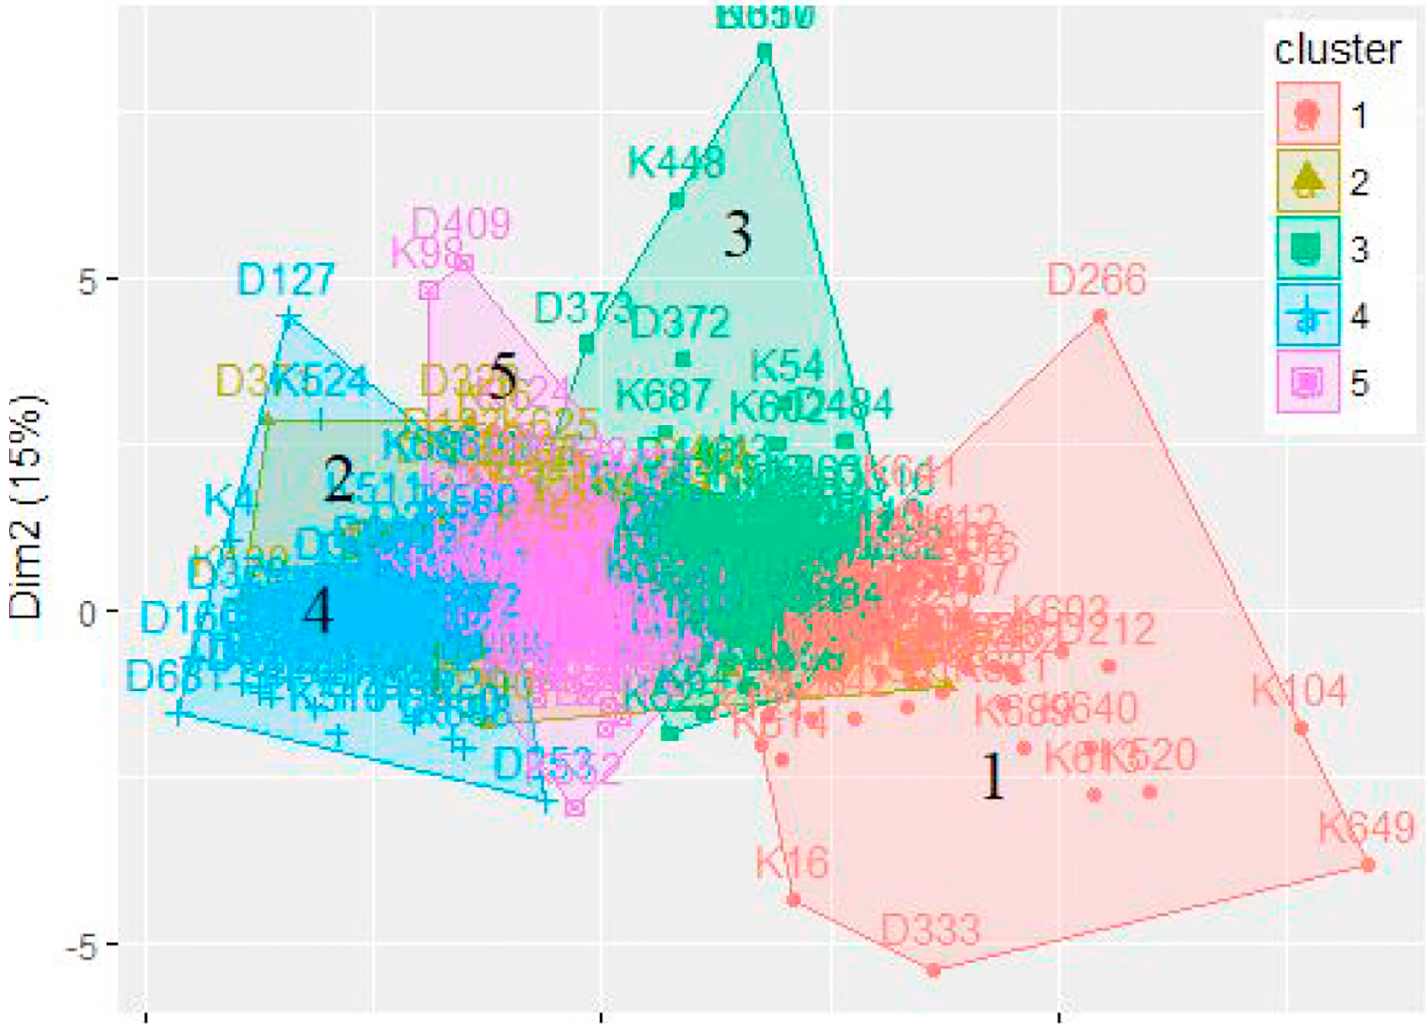 Fig 7: Visualization of 5 distinct emotional clusters, revealing how geographic origin subconsciously segments OSN users.
Critical Insight & Future Outlook
This work moves Social Network Analysis (SNA) closer to a legitimate diagnostic tool.
The Takeaway: If we can map emotional degradation in real-time through OSN data, public health fruit can intervene earlier. However, the study has limitations: it relies on a lexicon-based approach which may miss sarcasm or complex linguistic structures.
Future Work: The logical next step is Semantic-based analysis (using LLMs) to understand the intent behind the emotion, moving from "What words are used?" to "What is the user's specific trauma?" This could revolutionize how we provide psychological aid to populations in "invisible" crisis zones.