
Beyond Snapshots: The Vital Role of Temporal Distance in Social Networks
Temporal distance metrics for social network analysis
This paper introduces a novel framework of temporal distance metrics for Social Network Analysis (SNA), specifically proposing "Average Temporal Path Length," "Temporal Efficiency," and "Temporal Clustering." Validated on Bluetooth proximity and e-mail datasets, the metrics quantify information diffusion speed by accounting for the time-ordering and duration of contacts.
TL;DR
Classic Social Network Analysis (SNA) treats human interactions as static snapshots, yet reality is a fluid sequence of events. This paper introduces a specialized suite of temporal distance metrics that account for the specific time-ordering of contacts. By analyzing real-world Bluetooth and email traces, the authors demonstrate that traditional static metrics are "blind" to the actual delays of information diffusion, often predicting paths that are physically impossible due to temporal sequence mismatches.
Background: The Static Graph Illusion
For decades, researchers used static graphs to calculate "Small World" effects—the idea that everyone is connected by a few hops. However, if Alice meets Bob on Monday, and Bob meets Charlie on Sunday, Alice cannot send a message to Charlie through Bob. Static graphs ignore this "time-respecting" constraint, aggregating all interactions into a single, misleading structural map.
Why Temporal Metrics Matter
The authors identify several critical dimensions that static analysis misses:
- Time-Order: Paths must follow a chronological sequence.
- Absence of Symmetry: Just because A can reach B over time, it doesn’t mean B can reach A (due to the arrow of time).
- Inter-contact Time: The "dead time" between interactions directly determines the speed of information spread.
Methodology: Redefining Distance
The core of the paper is the definition of Temporal Path Length () and Temporal Efficiency ().
1. The Temporal Graph Model
The network is viewed as a sequence of time windows . A path only exists if it transits through these windows in increasing order.
2. The Algorithm
The authors utilize a Depth-First Search (DFS) variant that tracks two lists:
- R (Reached): Boolean status of node reachability.
- D (Distance): The number of temporal hops (windows) required to reach a node.
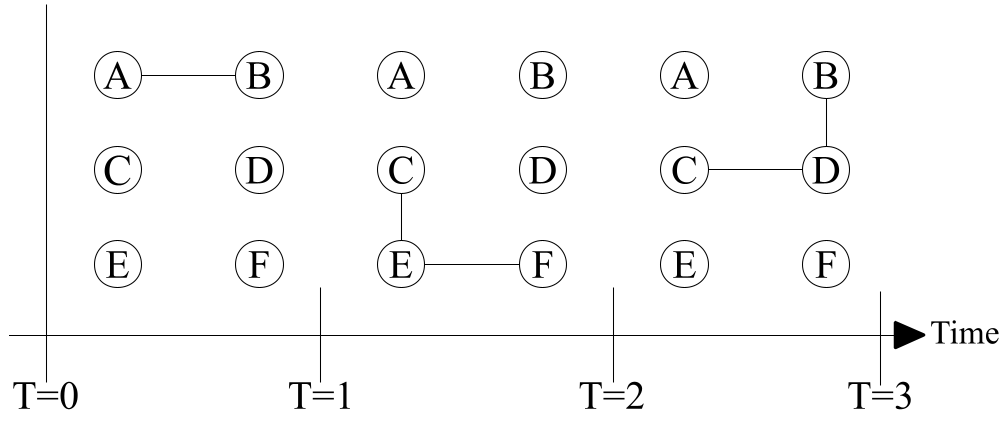 Figure 1: Comparison between a temporal graph (top) and its aggregated static counterpart (bottom). The static graph suggests a path from F to A that does not exist in time.
Experiments and Discovery
The researchers tested their metrics on three datasets: INFOCOM (conference Bluetooth), REALITY (MIT campus Bluetooth), and EMAIL (university logs).
Key Findings:
- The Diffusion Gap: In the INFOCOM trace, while a static graph suggested a path length of ~1.3 hops, the actual temporal reality required an average of 10 to 19 hours for information to traverse the network.
- E-mail vs. Physical Proximity: Surprisingly, e-mail networks showed significantly lower efficiency () than physical proximity. E-mail interactions are sparse and lack the "bursty" group clustering found in face-to-face conference environments.
- Human Cycles: By "reshuffling" time windows (a null model), the authors found that human cyclic behavior (working hours, midweek sociability) actually slows down information spreading compared to random timing.
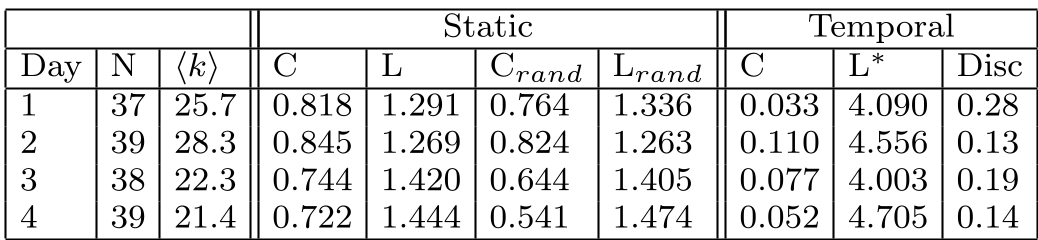 Table 2: Comparison of Static vs. Temporal metrics. Note the 'Disc' column, showing that a significant percentage of nodes are temporally disconnected, a fact invisible to static analysis.
Critical Insight: The "Small World" is Slower than you Think
The most profound takeaway is that the "Six Degrees of Separation" is a structural potential, not a temporal reality. While we may be structurally close to others, the temporal cost of those connections—waiting for the next meeting or the next email—is the true bottleneck of social dynamics.
Conclusion & Future Outlook
This work provides a rigorous mathematical foundation for "Time-Varying Graphs." While the current study uses fixed window sizes, it opens the door for:
- Temporal Centrality: Identifying "hubs" who are not just well-connected, but connected at the right times.
- Predictive Spreading: Better models for epidemic prevention by identifying temporal bottlenecks.
- Dynamic Routing: Improving data delivery in Delay-Tolerant Networks (DTNs) by leveraging known human temporal cycles.
As we move toward a world of ubiquitous mobile sensing, these temporal metrics will become the standard for understanding how ideas, viruses, and data move through the human fabric.