
Temporal Distance: Why Your Social Network is Slower Than You Think
Temporal distance metrics for social network analysis
This paper introduces a novel framework of temporal distance metrics for social network analysis, including average temporal path length, efficiency, and clustering. By representing networks as sequences of time windows, the authors quantify the speed of information diffusion in time-varying graphs, achieving a more realistic measurement of reachability than static models.
TL;DR
Most social network analysis treats connections as a static "snapshot," assuming if Alice knows Bob and Bob knows Charlie, information can flow freely. In reality, Alice might only see Bob on Mondays, and Bob only sees Charlie on Sundays. In this paper, researchers from Cambridge and Catania introduce Temporal Distance Metrics to account for the "arrow of time," proving that static analysis drastically overestimates how fast information actually spreads.
Problem & Motivation: The Illusion of Connectivity
In the "small-world" paradigm, we often celebrate that everyone is separated by only "six degrees." However, this is a mathematical artifact of Static Aggregation.
Traditional metrics aggregate all links that occurred over a week into a single graph. This creates "ghost paths" that don't exist in sequence. If Node A contacts Node B at 5:00 PM, but Node B contacted Node C at 10:00 AM, the static graph shows a path from A to C, even though information cannot flow backwards in time.
The authors argue that to understand Information Diffusion, we must respect:
- Time Ordering: Paths must follow a chronological sequence.
- Contact Duration: Influence requires time to "dwell."
- Inter-contact Time: The "silence" between meetings determines the delay.
Methodology: Mining the Temporal Dimension
The authors define a Temporal Graph () as a sequence of time windows. Within each window, they apply a depth-first search (DFS) to find the "Shortest Temporal Distance."
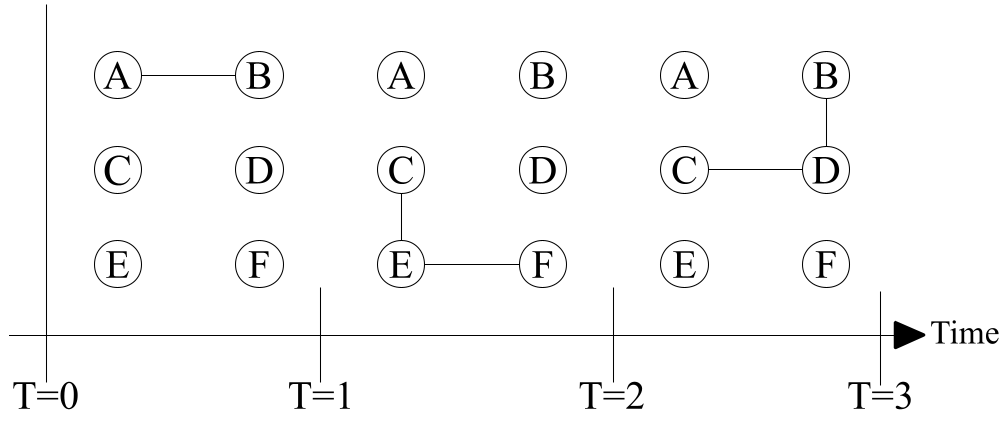 Figure: Comparison between a time-varying graph (top) and its aggregated static counterpart (bottom). In the temporal version, F is unreachable from A because the contacts occur in the wrong order.
Key metrics introduced:
- Temporal Path Length (): The average time (in hours/days) it takes for a message to traverse the network.
- Temporal Efficiency (): The inverse of temporal distance. Crucially, if two nodes never connect via a time-respecting path, their efficiency is 0, whereas static metrics often ignore these gaps.
- Temporal Clustering (): Measures how often a node's neighbors interact simultaneously or in sequence, capturing the "tightness" of social circles across time.
Experiments: Human Proximity vs. Digital Logs
The researchers tested their theory on three distinct datasets:
- INFOCOM: Bluetooth logs from a high-density tech conference.
- REALITY: Long-term Bluetooth proximity data from MIT students.
- EMAIL: Logs from a German university.
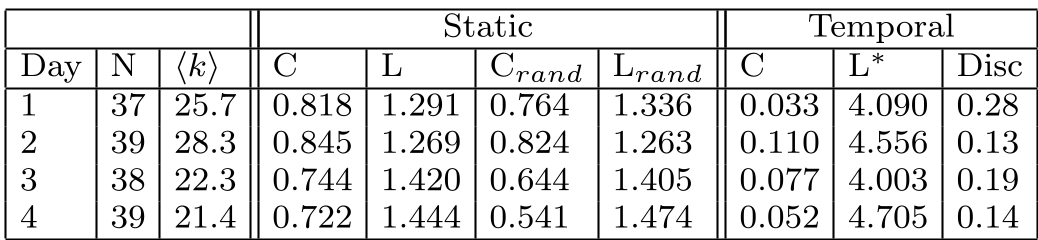 Table: Comparison shows that Temporal Path Length () is significantly higher than Static , and the 'Disc' column highlights a high percentage of pairs that can never actually exchange information.
Key Findings:
- The "Wait" Factor: In the INFOCOM data, messages could take nearly 20 hours to reach everyone, even in a small group of 41 people. Static metrics suggested "instant" connectivity.
- Digital Slowness: Interestingly, E-mail networks showed the lowest efficiency. Unlike physical proximity where groups meet and "broadcast" information, e-mails are fragmented, point-to-point, and often involve significant reply delays.
- Human Cycles: By "reshuffling" the timing of contacts (destroying the daily routine), the researchers found that information flowed faster in randomized models. Our habit of sleeping and working in cycles actually forms a bottleneck for network-wide communication.
Critical Analysis & Conclusion
This work is a seminal shift from Topology to Dynamics. It demonstrates that "who you know" is only half the story; "when you see them" is what dictates the power of a network.
Limitations:
- Window Sensitivity: The "granularity" of the time window () can distort results. If is too large, it collapses back into a static graph; if too small, it may miss meaningful interactions.
- Horizon Constraints: The model assumes information moves one "hop" per window, which might not fit all communication types (like instant messaging).
Future Outlook
These temporal metrics are vital for modern applications like epidemiology (predicting virus spread) and mobile ad-hoc networking (routing data between moving devices). As we collect more high-resolution tracking data, the "time-respecting path" will likely replace the "shortest path" as the gold standard for network science.