
Tesseract: Bridging the Gap Between Code Architecture and Social Collaboration
Tesseract: Interactive visual exploration of socio-technical relationships in software development
This paper introduces Tesseract, an interactive exploratory environment designed to visualize the complex cross-links between social and technical relationships in software development. By integrating data from source code repositories, mailing lists, and issue trackers, Tesseract provides a multi-perspective view (artifacts, developers, bugs, and communications) to highlight coordination requirements and socio-technical congruence.
TL;DR
Project success in software development depends not just on clean code, but on the "congruence" between technical dependencies and human communication. Tesseract is a pioneering interactive tool that visualizes these socio-technical links, helping teams identify where they are failing to talk despite working on interdependent code.
The "Invisible" Friction in Software Teams
Why do some projects with talented developers still suffer from integration hell? The answer often lies in Conway's Law: organizations are constrained to produce designs which are copies of their communication structures.
The authors argue that technical dependencies (File A needs File B) create "coordination requirements." If the developers of File A and File B don't communicate, the risk of a defect sky-rockets. Prior tools focused on either social networks (SNA) or code analysis, but rarely both. Tesseract was born to reveal the "red flags" where technical links exist without social backup.
Methodology: The Four Pillars of Tesseract
Tesseract doesn't just display data; it cross-references four distinct dimensions of a project:
- Project Activity Pane: A time-series timeline of commits and communications.
- File Network Pane: Visualizes "logical coupling"—files that are frequently committed together are linked, regardless of their folder structure.
- Developer Network Pane: Connects developers based on shared tasks. Green edges mean they are communicating as required; Red edges signify a coordination gap.
- Issues Pane: Tracks bugs and features, linking them back to the code and people involved.
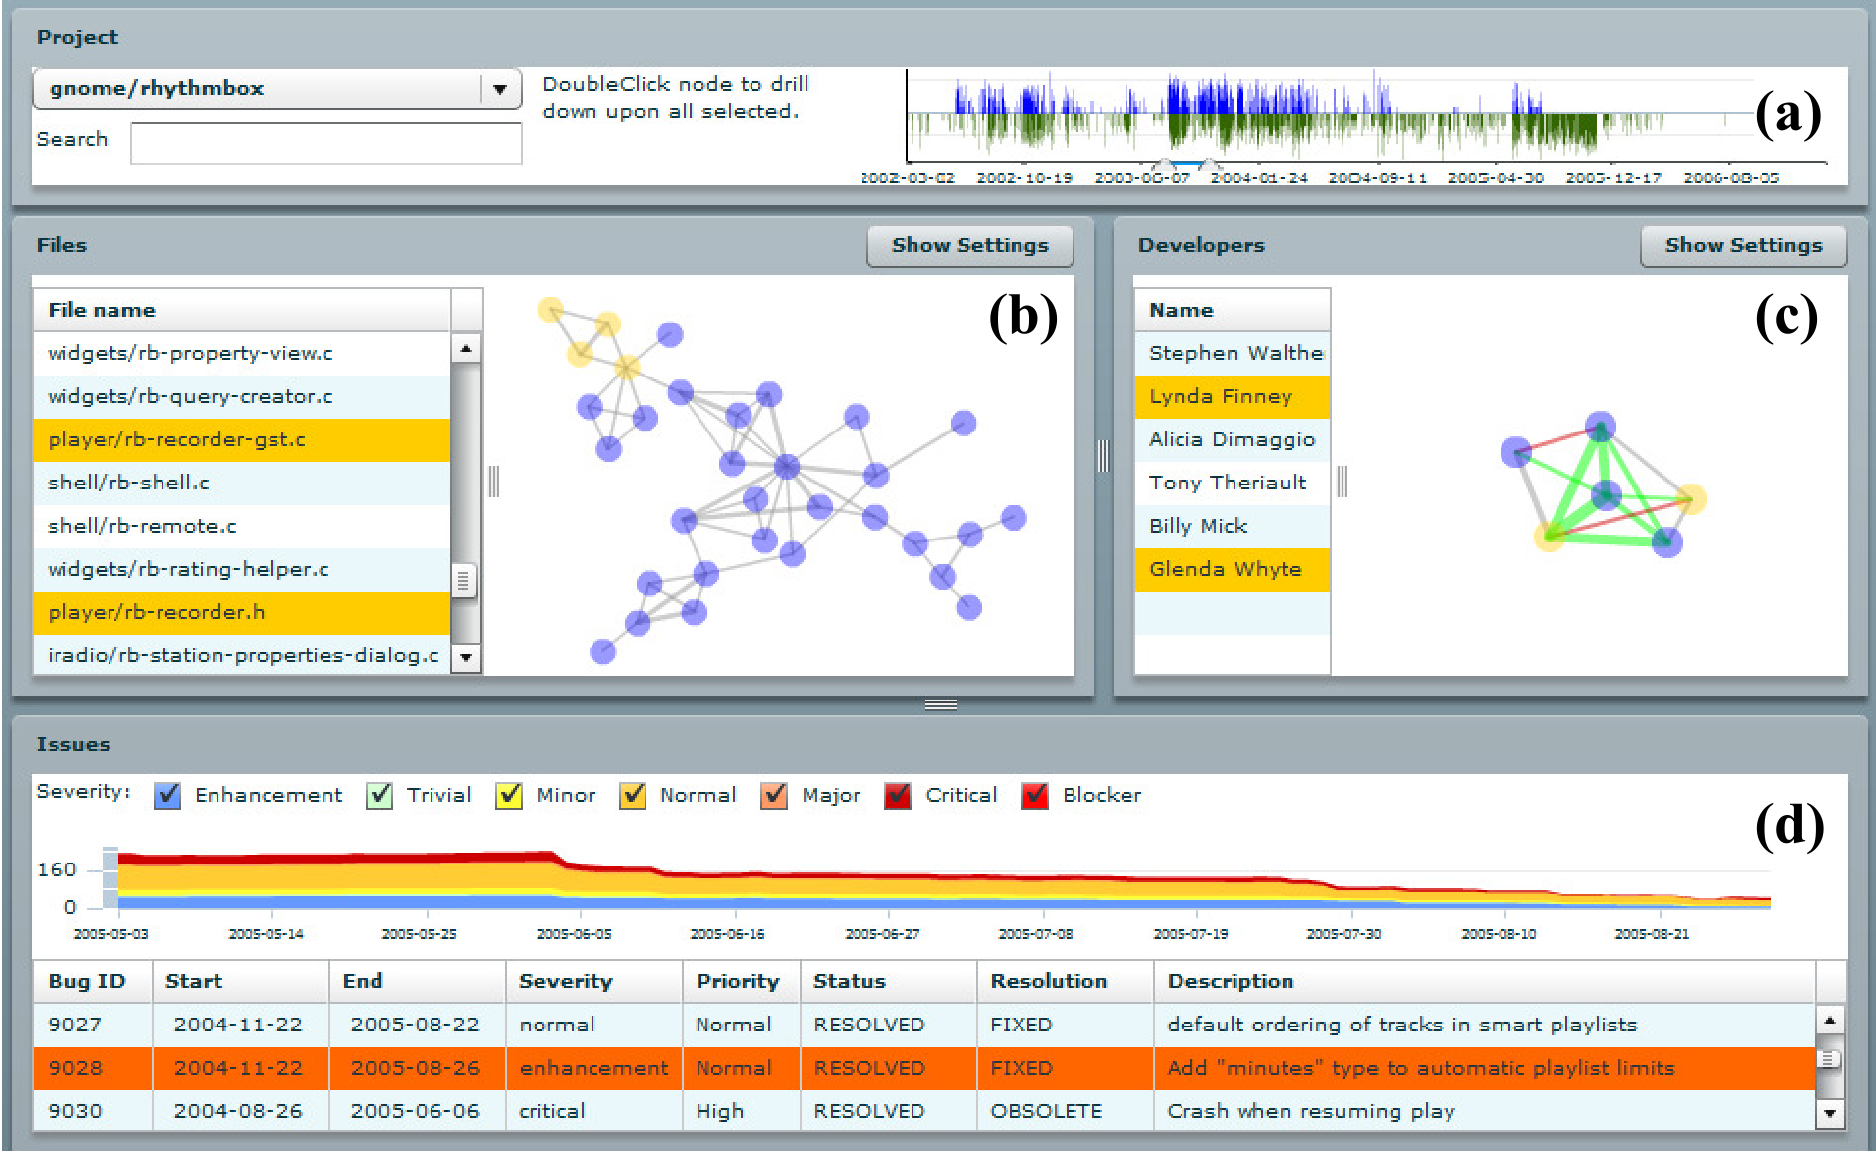 Figure 1: The Tesseract UI showing the synchronization between activity timelines, file dependencies, and developer networks.
Why Logical Coupling Over Static Analysis?
The authors made a strategic choice: instead of using call-graph analysis (which can be slow and language-specific), they used commit history. If two files are always updated in the same commit, they are "logically coupled." This captures dependencies that static analysis might miss, such as remote procedure calls or shared configuration files.
Insights from the GNOME Project
The team tested Tesseract on the massive GNOME ecosystem. One of the most striking findings was the visualization of "Development Patterns."
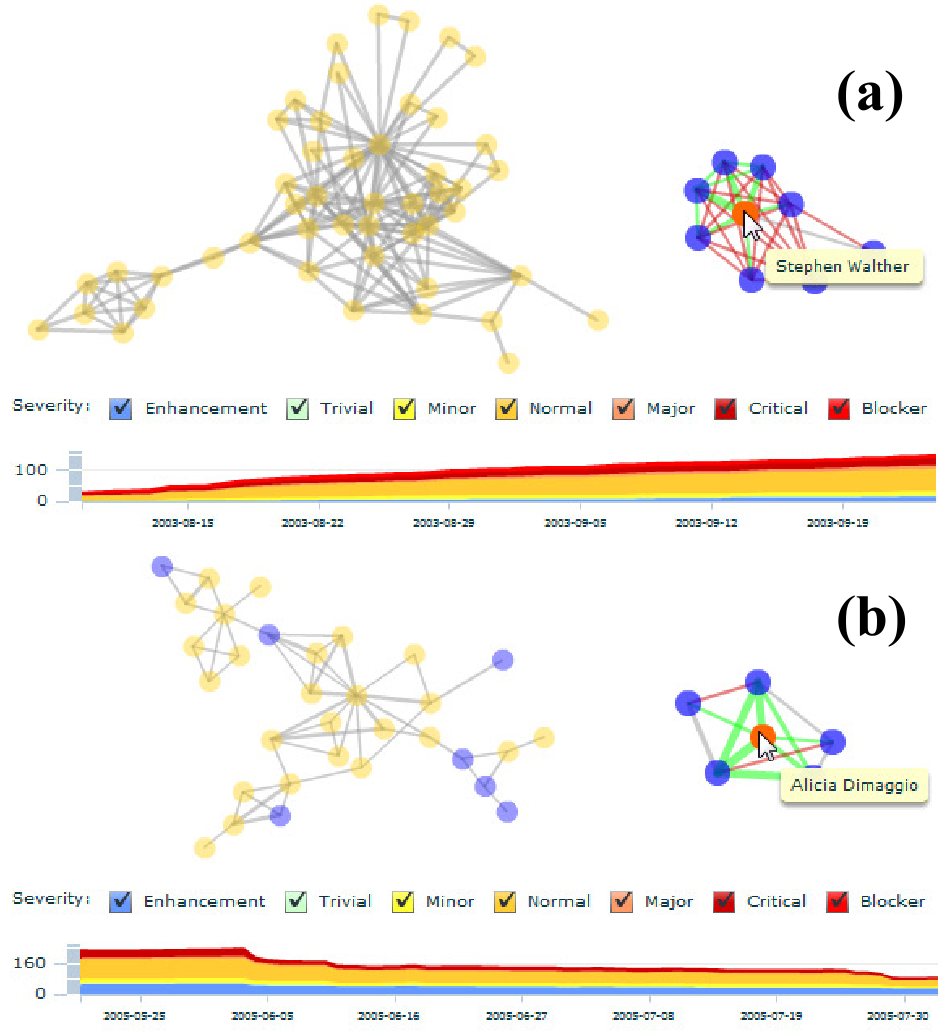 Figure 2: Comparing two snapshots of project history. (a) Shows a "star" pattern where one person (Stephen) does everything but others don't talk. (b) Shows a more mature, distributed communication structure.
As seen in Figure 2, Tesseract can visually distinguish between a "hero-based" development model (high central dependency, low peer communication) and a "collaborative" model. Interestingly, the collaborative model (b) correlated with a decreasing trend in open bugs, providing visual evidence for the value of socio-technical congruence.
Practical Value: From New Hires to Managers
The evaluation highlighted two key use cases:
- The Newcomer's Compass: New developers used Tesseract to find "Expertise Locations." Instead of guessing who to ask, they could see who had touched the most logically related files in the last six months.
- The Manager's Dashboard: Project leads used the "Red Edges" to identify silos. If two sub-teams were working on interdependent modules but had zero email exchange, a manager could intervene before a "collision" occurred during integration.
Critical Analysis & Future Outlook
While Tesseract provides a brilliant "retrospective" view, its current implementation relies on post-hoc analysis of logs. The real future of this technology lies in real-time awareness. Imagine an IDE plugin that turns your sidebar red because you just edited a file that is logically coupled to a change your teammate made ten minutes ago in a different branch.
Limitations:
- Identity Resolution: Matching "anita123" on GitHub to "a.sarma@email.com" in a mailing list remains a significant heuristic challenge.
- Noise: Not every commit-together implies a deep technical dependency; sometimes it's just a bulk documentation update.
Conclusion
Tesseract shifts the focus from "What is the code doing?" to "Are the right people talking about the right code?" In an era of increasingly distributed and open-source development, these socio-technical insights are no longer "optional"—they are the key to building sustainable software ecosystems.