
Test Case Prioritization: Strategic Regression Testing through APFD Optimization
Test case prioritization: a family of empirical studies
This paper presents a comprehensive empirical evaluation of "Test Case Prioritization" (TCP) techniques aimed at improving the rate of fault detection in regression testing. It introduces 18 techniques spanning fine-grained (statement-level) and coarse-grained (function-level) granularities, while incorporating novel predictors like Fault-Exposing Potential (FEP) and Fault Proneness (FI) to achieve significant improvements in detection rates as measured by the APFD metric.
TL;DR
Regression testing is a notorious bottleneck in software delivery. This seminal paper by Elbaum et al. explores how to reorder test cases to find bugs faster. By comparing 18 different techniques—from simple code coverage to complex fault-proneness models—the authors demonstrate that even coarse-grained function-level analysis can significantly accelerate fault detection, though the "theoretical optimal" remains a distant target.
The Core Conflict: Precision vs. Cost
In a perfect world, we would instrument every line of code to understand exactly what a test covers. In the real world, statement-level instrumentation is too slow for large systems (like the 300K LOC QTB system studied here). The authors ask a pivoting question: Can we get away with function-level analysis without losing the ability to find bugs quickly?
Methodology: The 18-Technique Spectrum
The authors categorized their approach into three buckets:
- Granularity: Statement-level (fine) vs. Function-level (coarse).
- Feedback (Total vs. Additional): "Total" techniques order tests once based on initial coverage; "Additional" techniques dynamically re-calculate remaining coverage after each test is "run."
- Predictive Power: Using FEP (Fault-Exposing Potential) via mutation analysis and FI (Fault Index) via code complexity metrics.
 Figure 1: Conceptual overview of how prioritization seeks to "front-load" fault detection compared to random or untreated orderings.
The APFD Metric
To measure success, they use APFD (Average Percentage of Faults Detected). It essentially measures the area under the curve of faults found over the percentage of the test suite executed. A higher APFD means you found the majority of your bugs in the first 10-20% of your test run.
Key Insights from the Study
1. The Granularity Paradox
While statement-level techniques theoretically provide more data, the performance drop when moving to function-level analysis was minimal. In their experiments, statement-level coverage achieved approximately 80.7% APFD, while function-level coverage reached 77.4%. For a massive system, the 3% loss in detection speed is often a fair trade for the 10x reduction in instrumentation overhead.
2. The "Additional" Strategy Wins
Techniques that use feedback (greedy "additional coverage" algorithms) consistently beat "total coverage" strategies. Why? Because the "additional" strategy avoids redundancy by prioritizing tests that hit code not yet exercised by previous tests in the queue.
3. Fault-Proneness: A Surprising Result
The authors hypothesized that focusing on "bug-prone" areas (code that changed a lot recently) would dramatically increase APFD. However, the gains were relatively small. This suggests that coverage is a much more robust proxy for fault detection than complexity metrics alone.
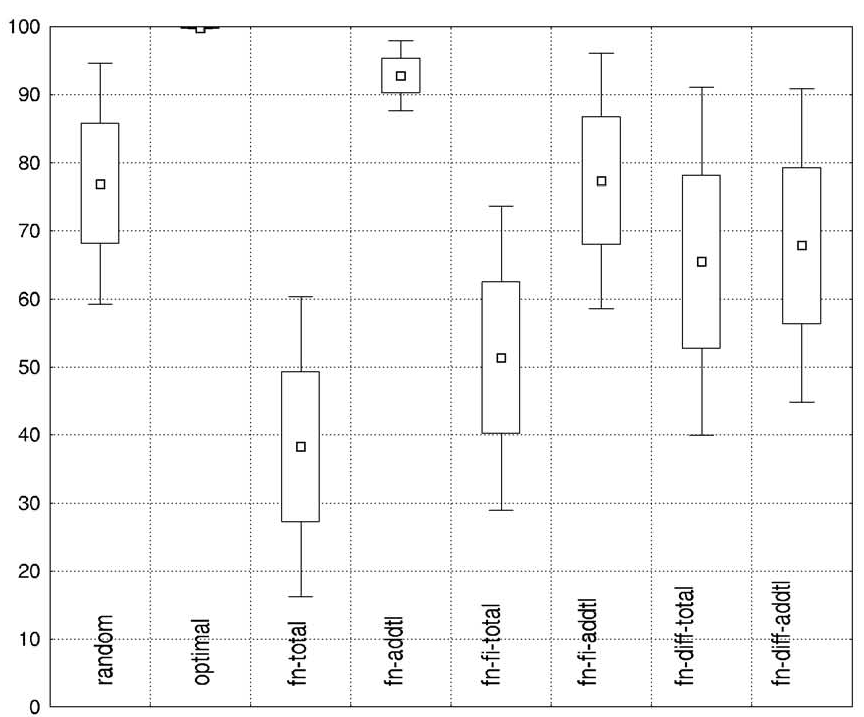 Figure 2: APFD distribution across different subjects. Note how "Optimal" (T2) towers over the heuristics, showing there is still a massive gap for future AI-driven prioritization to fill.
Practical Significance: The "Savings Factor"
The paper concludes with a brilliant cost-benefit analysis. A 1% increase in APFD isn't always worth a more complex tool. If your tests take 5 minutes, speed doesn't matter. If your tests take 27 days (like the QTB system), a 5% gain in APFD could save days of developer downtime. This "Savings Factor" (SF) should be the north star for any QA manager deciding which technique to implement.
Critical Perspective
- Limitations: The study relies on mutation analysis for FEP, which is computationally expensive and rarely used in industry.
- The Bottom Line: If you are just starting with Test Case Prioritization, start with Additional Function Coverage. It offers the best ROI by providing high detection rates with manageable instrumentation costs.
Conclusion
Elbaum et al. successfully shifted the conversation from "Does prioritization work?" to "At what cost does it work?". By proving that version-specific, function-level prioritization is effective, they paved the way for the modern CI/CD "Smart Test" features we see in tools today.