
Beyond Topology: Measuring Topical Cohesion in Twitter Communities
Topical cohesion of communities on Twitter
This paper introduces a novel evaluation framework for measuring the topical cohesion of communities in Online Social Networks (OSN), specifically Twitter. By applying the Louvain community detection algorithm to interaction-based graphs (Retweets, Replies, Mentions) and utilizing Latent Semantic Analysis (LSA) for topic modeling, the authors derive two new metrics: Expertise (ξ) and Representativeness (ρ).
TL;DR
Is a social media community defined by who you talk to, or what you talk about? Most algorithms assume the former, but this paper argues that without Topical Cohesion, detected communities are often meaningless. The researchers introduce two metrics—Expertise (ξ) and Representativeness (ρ)—to bridge the gap between graph theory and NLP, proving that standard community detection often fails to group users with shared interests.
The "Graph vs. Topic" Schism
In the world of social network analysis, there has long been a divide. On one side, mathematicians use algorithms like Louvain or Walktrap to find "tight" clusters based on edges (retweets, follows). On the other side, NLP experts use Latent Semantic Analysis (LSA) to cluster users by their vocabulary.
The problem? Structural clusters (people who interact) often don't share the same topics, and topical clusters (people talking about the same thing) often don't interact. This "semantic gap" makes it difficult for brand managers or political analysts to identify truly coherent groups.
Methodology: Interaction Over Structure
The authors move away from the "static" social graph (following/followers) because it doesn't reflect active engagement. Instead, they build an Interaction Graph based on three weighted actions:
- Retweets (RT): Signifying agreement or amplification.
- Replies (RE): Signifying direct conversation (often more diverse/confrontational).
- Mentions (ME): General interaction.
The Two Pillars of Evaluation
Once communities are detected via the Louvain method, the paper evaluates them using:
- Expertise (): The percentage of users in a group who share the group's "dominant" topic. High means a specialized "echo chamber."
- Representativeness (): The percentage of the global population interested in a topic that is contained within this specific group. High indicates a "central hub" for a topic.
 Note: The study utilized a large-scale corpus from the 2016 US Election to test these metrics.
Key Findings: The Reality of Twitter Echo Chambers
The results from the 8.6 million tweet corpus provide a sobering look at community detection:
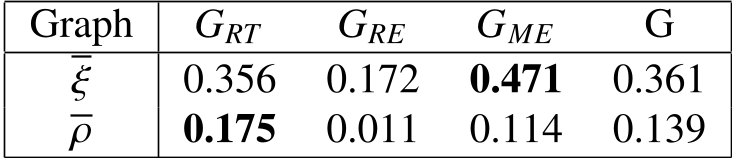
- Low Global Cohesion: The average Expertise () across the interaction graph was only 0.361, meaning in a typical group, nearly 64% of members were actually more interested in a topic other than the group's primary one.
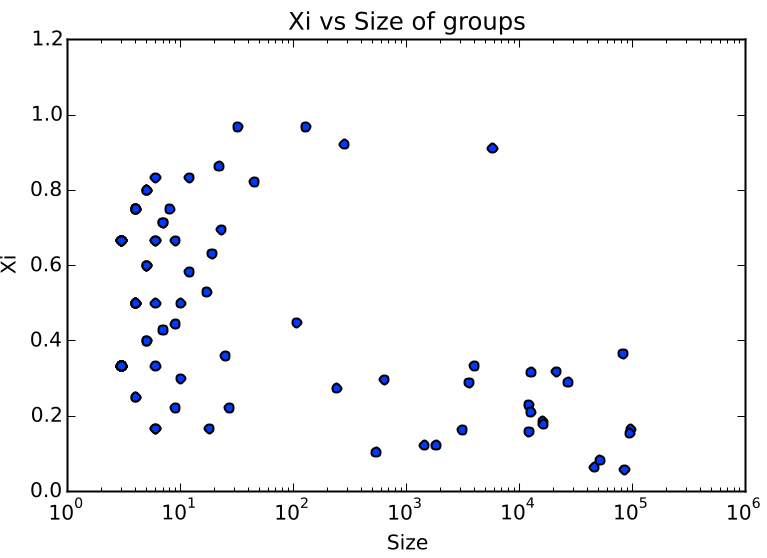
- Size vs. Focus: As shown in the chart below, larger groups tend to have higher Representativeness (simply because they are big) but much lower Expertise (because they become diluted).
- Graph Dynamics: The Mention Graph (G_ME) produced the most expert/coherent communities, while the Reply Graph (G_RE) was the most chaotic. The authors suggest that replies bring diversity and topical "tension," making them harder to cluster semantically.
SOTA Comparison
Compared to baseline modularity (), which only measures how "well-separated" clusters are in a graph, and provide a reality check. While the Louvain method achieved a modularity of 0.343 (structurally sound), the semantic metrics revealed that these clusters often lacked a unified "voice."
Critical Insight & Future Outlook
This work confirms a critical researcher intuition: Social interaction does not equal topical alignment.
The limitation of this study lies in its "hard clustering" approach—assigning each user to one community and one topic. In reality, users are multi-faceted. Future research should look into overlapping community detection where a user can belong to a "Politics" group and a "Sports" group simultaneously. For industry professionals in brand monitoring, these metrics provide a roadmap for identifying whether a community is a core audience (High ) or just a transient segment of a larger trend (High ).