
TRSP: Solving the "Back-and-Forth" Dilemma in Social Media Tour Recommendations
Tour recommendations by mining photo sharing social media
This paper proposes a novel tour recommendation framework that mines geotagged photos and hashtags from social media (Flickr) to recommend top-k personalized tours. The core methodology shifts from traditional point-by-point recommendations to an "area-by-area" approach using Mean-shift clustering and Latent Dirichlet Allocation (LDA).
TL;DR
Researchers from National Taiwan University have developed TRSP (Tour Recommendations by Sharing Photos), a framework that mines Flickr data to create efficient travel itineraries. By clustering landmarks into broader "areas" and using LDA to understand user interests through hashtags, the system prevents the efficient but illogical "zigzagging" across a city typical of older recommendation algorithms.
Background & Motivation: The Logic of Travel
When we travel, we don't just visit the most popular spots in order of their popularity. We visit them in order of geographical convenience.
Traditional SOTA models like the Markov-Topic method often recommend locations one by one. If Landmark A and C are in the North, and B and D are in the South, a naive algorithm might suggest A → B → C → D, forcing the traveler to cross the city three times. The authors argue that a truly "smart" system must understand Spatial Clusters and Latent Interests simultaneously.
Methodology: From Coordinates to Context
The TRSP framework operates on two distinct dimensions: spatial and semantic.
1. Spatial Hierarchies (Mean-Shift Clustering)
The system doesn't just see GPS points; it recognizes a hierarchy. It uses Mean-shift clustering twice:
- Layer 1: Aggregates messy GPS pings into distinct Landmarks (e.g., The Golden Gate Bridge).
- Layer 2: Aggregates neighboring landmarks into Areas (e.g., The Presidio district).
2. Semantic Profiling (LDA Model)
Using Latent Dirichlet Allocation (LDA), the system treats each landmark's collection of hashtags as a "document." It extracts topics (e.g., "Dining," "Architecture," "Nature") to build feature vectors for both landmarks and users.
 Figure 1: The proposed 4-phase framework for mining and recommendation.
3. The TRSP Scoring Engine
The final tour is calculated using a complex scoring function: It balances Popularity (POP), Personal Attraction (ATT) based on LDA topics, and Social Influence (RSU) from similar users.
Experiments: Superior Efficiency
Tested on San Francisco city data, the results showed a clear advantage for the area-based approach.
Performance vs. Trip Length
A critical finding was that as trip length increases, TRSP's performance improves relative to Markov-Topic. Why? Because over an 8-hour day, the "transportation tax" of going back and forth becomes so high that landmark-based models fail to provide a cohesive experience.
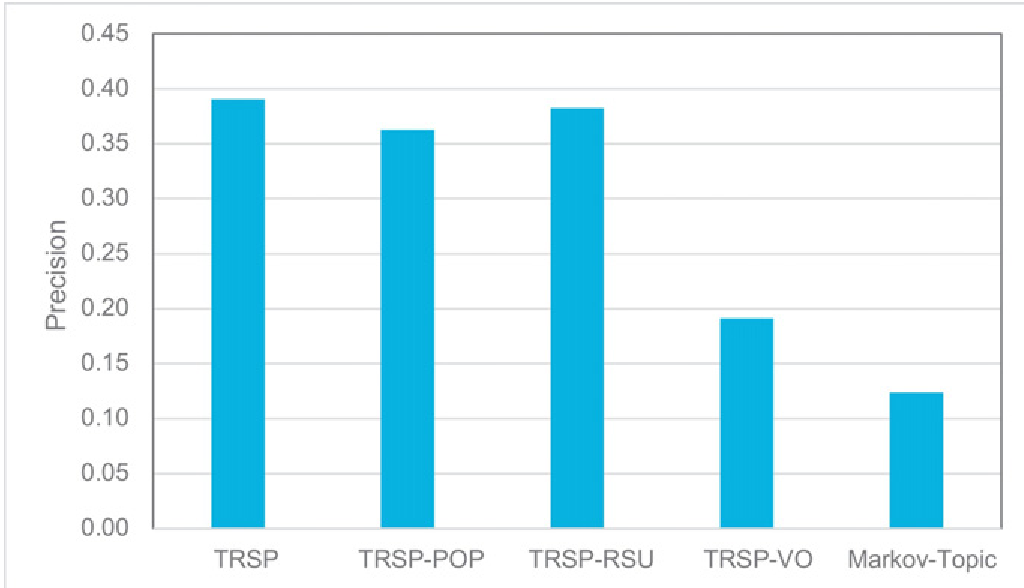 Figure 2: Precision of one-step prediction. Note how TRSP outperforms variations that ignore popularity or visiting order.
Visualizing the Change
The paper provides a stark contrast:
- Markov-Topic Tour: Only features 5 landmarks in 8 hours due to excessive travel.
- TRSP Tour: Manages 8 landmarks in the same timeframe by staying within logical area boundaries.
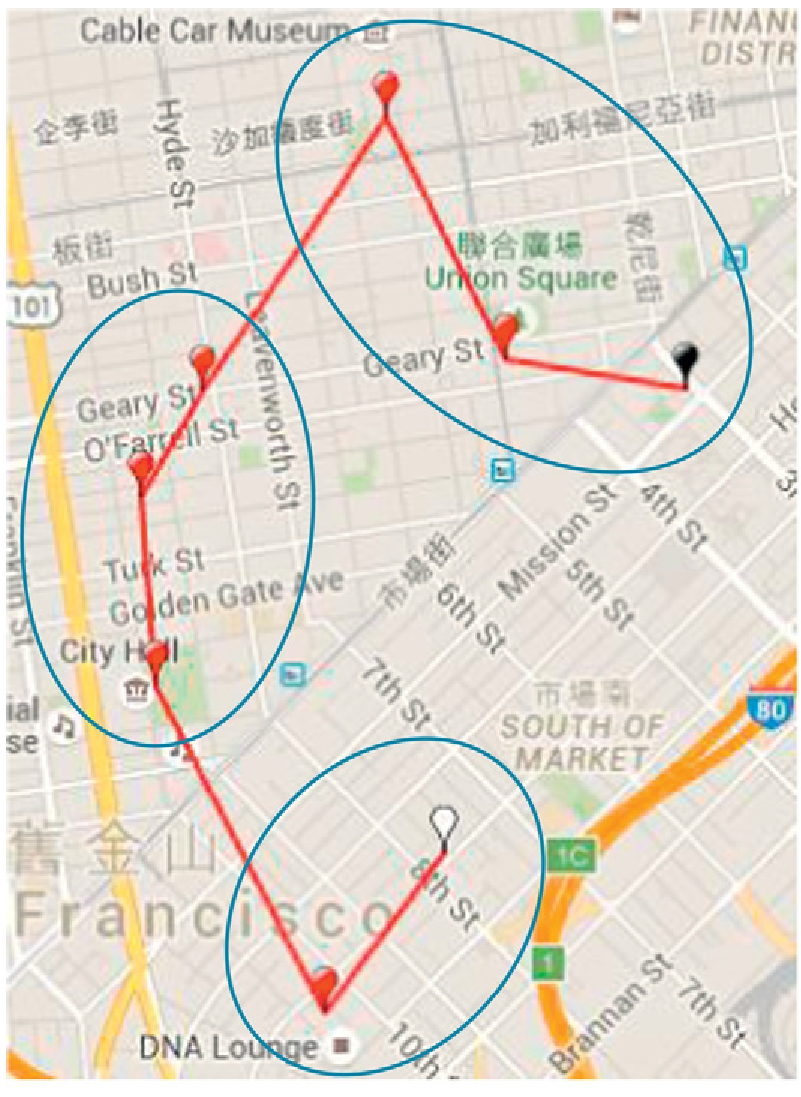 Figure 3: An example tour following the coastline, optimizing for time and interest.
Critical Insight & Conclusion
The genius of this work lies in its Inductive Bias toward spatial locality. By forcing the recommendation engine to think in terms of "Areas" first and "Landmarks" second, the authors bridged the gap between mathematical optimization and human common sense.
Limitations: The model relies heavily on the quality of hashtags. In a world of "spammy" or algorithmic tagging, the LDA model might require more robust pre-processing or the integration of Computer Vision (CV) to verify the content of the photos themselves.
Future Outlook: As we move toward more integrated digital twins for cities, algorithms like TRSP could be paired with real-time transit data to provide dynamic, traffic-aware tour adjustments.