
Profiling the Global Tourist: How Social Sensing Decodes Urban Mobility
Profiling the Mobility of Tourists Exploring Social Sensing
This paper explores tourist mobility patterns and profiling using Foursquare check-in data across four global cities: London, New York, Rio de Janeiro, and Tokyo. It introduces a spatiotemporal graph model and a Latent Dirichlet Allocation (LDA) based topic modeling approach to automatically distinguish between residents and tourists and identify thematic user profiles.
TL;DR
Researchers have developed a framework to identify and profile tourists using Foursquare check-ins. By mapping movements onto spatiotemporal graphs and applying LDA topic modeling, the study reveals that while tourists move less in total distance than residents, they explore diverse spots more intensely. This data-driven approach allows for better urban planning and hyper-personalized tourism services.
Background: Beyond the Survey
Understanding how people navigate a city is crucial for everything from transit development to emergency alerts. Traditionally, this was done via surveys—expensive, slow, and often inaccurate. Enter Social Sensing: using the digital footprints we leave on platforms like Foursquare to map the "pulse" of a city in real-time.
Problem & Motivation: The Resident vs. Tourist Gap
The core challenge lies in distinguishing a resident's routine (home-work-groceries) from a tourist's exploration. Previous work struggled to capture the temporal aspect—a museum at 10 AM is a very different functional space than a bar at 10 PM. The authors sought to provide a model that captures both the where and the when.
Methodology: Graphs and Topics
The research employs two sophisticated technical lenses:
1. Spatiotemporal Urban Mobility Graphs
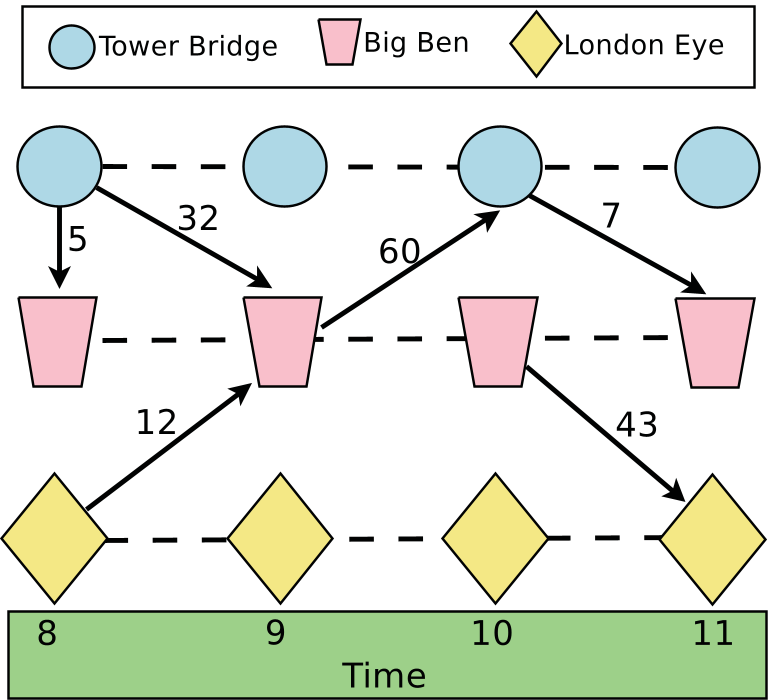
The authors don't just look at locations; they look at state-nodes. A node is defined as Venue[Hour].
- Closeness Centrality: Identifies "influential" spots where information (like a city emergency alert) would spread fastest.
- Betweenness Centrality: Finds "bridge" locations that connect different social tribes or activity clusters.
2. LDA for Behavioral Profiling
By treating a user’s check-in history like a "document" and venue categories (e.g., "Coffee Shop," "Historic Site") like "words," the authors used Latent Dirichlet Allocation (LDA) to uncover hidden themes. This allows the system to automatically say "This user is a Business Traveler" because their "document" is heavy on "Office" and "Airport" words.
Key Insights & Results
The findings challenge some common assumptions about mobility:
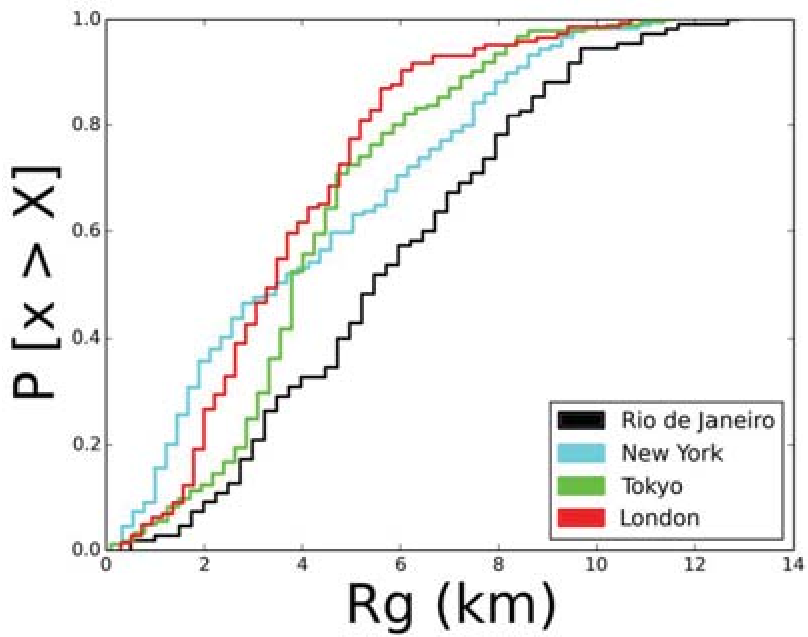
- Spatial Constraints: Tourists actually travel shorter total distances than residents. In London, 80% of tourists move less than 5km. This is likely due to "magnet areas"—tourists cluster in specific dense zones while residents traverse the whole city for work.
- Exploration Density: Despite staying in smaller areas (lower Radius of Gyration), tourists visit a wider variety of unique subcategories compared to residents in the same space.
- Profile Identification: In Rio de Janeiro, the model successfully isolated the "Commuter" (high subway/bus usage) from the "Leisure Tourist" (high beach/hotel usage).
Critical Analysis & Future Outlook
This work demonstrates the power of Location-Based Social Networks (LBSN) to provide high-resolution urban intelligence. However, there are inherent limitations:
- Demographic Bias: Social media users are typically younger and more tech-savvy; the "Golden Ager" tourist might be invisible in this dataset.
- Data Scarcity: Many users only check in sporadically, making the "Radius of Gyration" difficult to calculate accurately for the casual user.
The Takeaway: Future smart cities will likely use these graph models to provide "Tourist Dashboards" for local governments, allowing them to see where visitors are clustering and how to redistribute urban "load" to prevent over-tourism.