
iSafe: Transforming Urban Public Safety through Mobile Privacy and Social Intelligence
Towards Safe Cities: A Mobile and Social Networking Approach
The paper introduces iSafe, a comprehensive framework for smart and safe cities that leverages mobile and social networking data to provide personalized safety metrics. It utilizes crime datasets, census data, and Yelp reviews to model location-based safety and employs a privacy-preserving distributed algorithm to assess real-time safety via co-located mobile devices.
TL;DR
iSafe is a multi-dimensional framework designed to make "Smart Cities" safer by replacing static crime maps with personalized, real-time safety indices. By combining historical crime data forecasting with a privacy-preserving distributed algorithm (iSafe), the system allows users to understand the safety of their surroundings based on both historical trends and the real-time context of anonymous nearby users.
Background & Motivation: Why Static Maps Fail
Traditional public safety applications usually rely on heatmaps of past crimes. However, the authors argue that safety is volatile and personal. A park that is safe at 2 PM may be dangerous at 2 AM, and an area perceived as "unsafe" by one person might be "normal" for another based on their personal trajectory and comfort level.
The core challenge is two-fold:
- Forecasting: How do we predict if a location will be safe at the moment of arrival?
- Privacy: How can we use the wisdom of the crowd (co-located users) to determine safety without tracking everyone's every move?
Methodology: The iSafe Architecture
The authors approach the problem through a tiered methodology:
1. Weighted Safety Labeling
Not all crimes are equal. The paper uses the Florida Criminal Punishment Code (FCPC) to assign weights to different crime types. A "Robbery" is weighted higher than a "Larceny" based on the actual legal penalties, creating a more nuanced Safety Index (SI).
2. Time-Series Forecasting
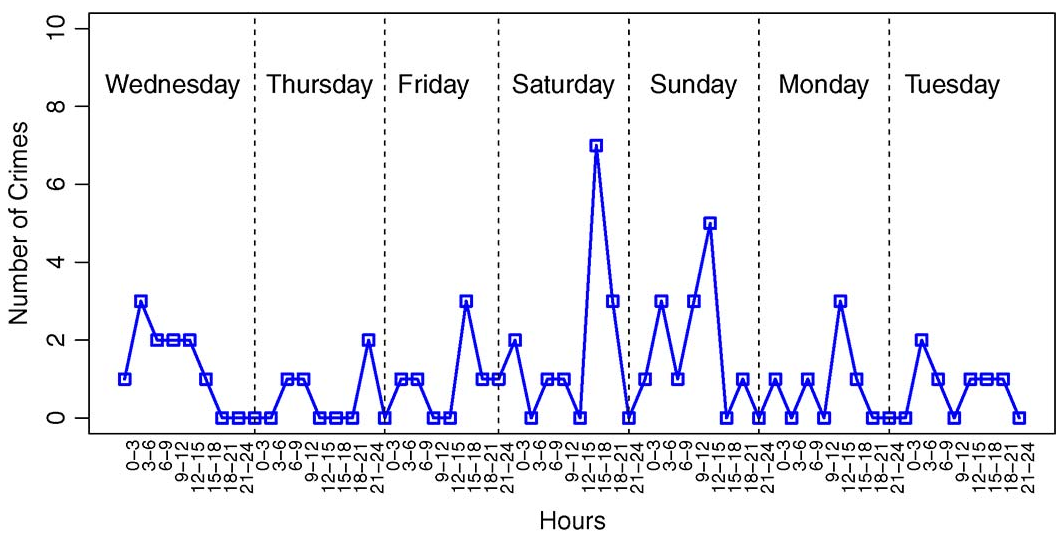
Instead of just looking at the past, the system uses ARIMA (Auto-Regressive Integrated Moving Average) and Artificial Neural Networks (ANN) to predict future crime levels. This allows the system to factor in seasonal and daily fluctuations.
3. The iSafe Distributed Algorithm
When historical data is missing or unreliable (e.g., during a riot or natural disaster), iSafe shifts to Context-Aware Safety. It uses a distributed protocol where nearby devices form an ad-hoc community to calculate a "Super-User" safety profile.
The Secret Splitting Logic:
- Each user splits their safety data (trajectory history) into random "shares."
- These shares are exchanged with neighbors.
- Through a leader-election process, the community calculates the sum of safety scores without any single device seeing another's raw data.
Experiments: Validation via Miami-Dade & Yelp
The authors validated iSafe using 2.3 million crime records and 7,699 Yelp venues.
Key Findings:
- Geosocial Proxy: There is a statistically significant correlation between Yelp ratings and crime levels; higher-rated venues are predominantly located in safer census blocks.
- Forecasting Accuracy: ANN models correctly predicted downward trends in crime, outperforming simple moving averages.
- Performance: On a standard smartphone, the secret splitting and reconstruction take mere milliseconds (4.5ms - 16ms), making real-time use highly feasible.

Deep Insight: The Social Dimension of Safety
One of the most profound insights in this paper is the comparison between a Block's Safety Index and the Average Safety Index of Yelp visitors. The study found that the safety profiles of people who visit a place are an excellent proxy for the safety of the place itself. This means that even in areas where the police do not provide transparent data, social network check-ins can fill the gap.
Critical Analysis & Conclusion
iSafe successfully bridges the gap between big data (official crime records) and small data (individual user context).
Limitations:
- The system assumes a "semi-honest" service provider. In a truly adversarial state environment, even more robust encryption (like Homomorphic Encryption) might be needed.
- Relying on Bluetooth for ad-hoc communities has range limitations (~10-30 meters), which might be too small for sparse urban environments.
Future Outlook: The integration of this tech into navigation apps (e.g., "Take the safest route" instead of just "Take the fastest route") is the logical next step for the industry. This paper provides the mathematical and privacy framework to make that a reality without sacrificing user anonymity.