
GED: Tracking the Heartbeat of Social Groups through Member Quality
Tracking Group Evolution in Social Networks
This paper introduces GED (Group Evolution Discovery), a novel framework for tracking the dynamics of communities in temporal social networks. By leveraging a new "inclusion" measure that combines member quantity and quality (centrality), the method identifies seven distinct evolutionary events, including shifting, merging, and splitting.
TL;DR
Social networks are not static; they breathe, grow, and fragment. The GED (Group Evolution Discovery) method provides a robust framework for tracking these dynamics by looking past simple headcounts. By introducing an "Inclusion" metric that weights members by their social importance, GED can accurately identify when a group is merely shrinking or when it has fundamentally split into new entities.
Background: Static Snapshots are Not Enough
Most community detection algorithms treat social networks as frozen in time. However, real-world networks—from Slack channels to academic collaboration webs—are Temporal Social Networks (TSN). The challenge lies in "Identity Tracking": if Group A in Timeframe 1 changes slightly in Timeframe 2, is it still Group A? Existing methods often fail because they treat every member as equal, ignoring the fact that the departure of a "leader" (high centrality node) impacts a group far more than the departure of a peripheral member.
The "Inclusion" Insight: Quantity meets Quality
The core contribution of this paper is the Inclusion Measure (). It doesn't just ask "How many members moved?"; it asks "How much influence moved?".
The formula is elegantly split into two components:
- Group Quantity: The ratio of shared members to the original group size.
- Group Quality: The ratio of the sum of Social Positions (SP) of shared members to the total SP of the original group.
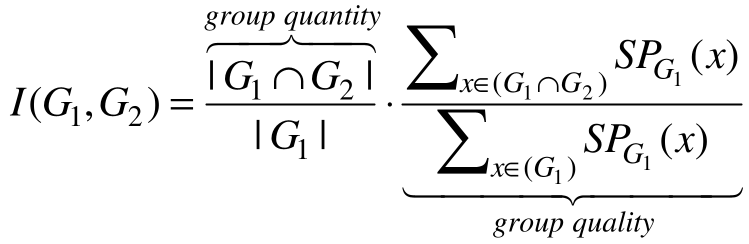
This dual approach prevents "noisy" peripheral members from triggering false evolution events while ensuring that the core "influencers" define the group's trajectory.
Mapping the Lifecycle of a Community
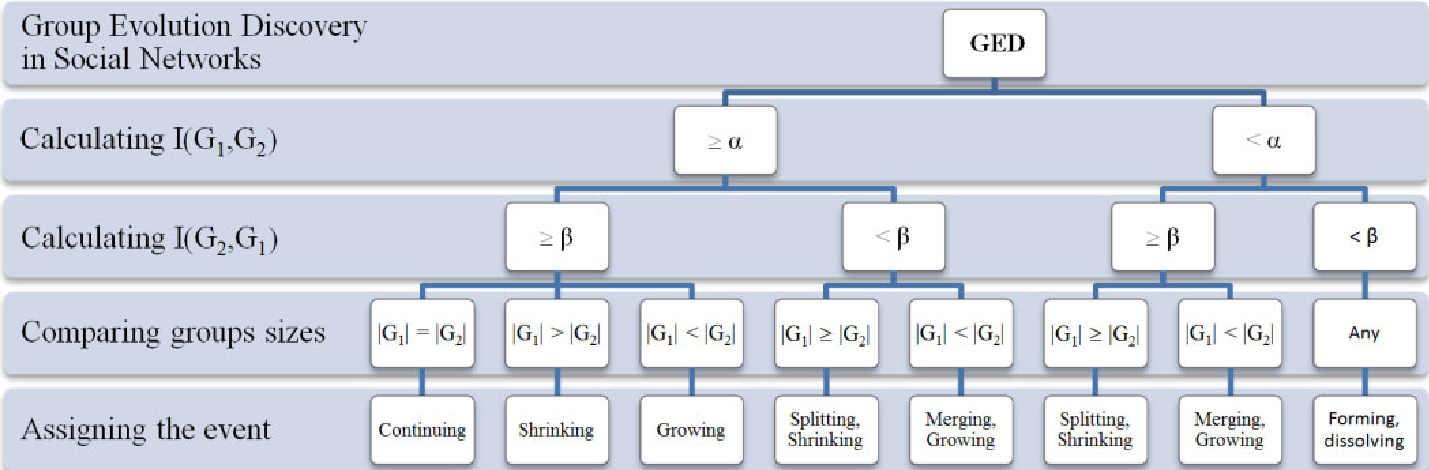
The GED method formalizes seven specific events that a group can undergo between two timeframes ( and ):
- Continuing/Stagnation: High bidirectional inclusion and identical size.
- Growing/Shrinking: Changes in size but high inclusion of the smaller group into the larger one.
- Splitting/Merging: The most complex events, where one group fragments into many, or many coalesce into one. GED distinguishes these by checking if there are multiple matches in the adjacent timeframe.
- Forming/Dissolving: When the inclusion levels drop below a critical threshold (e.g., 10%), signifying the birth or death of a community.
Why This Matters: Adjusting the "Sensitivity"
One of the strengths of GED is its flexibility. Through the parameters and , researchers can tune the sensitivity of the evolution discovery. If and are set high (near 100%), the model becomes very "strict," only recognizing evolution when groups are nearly identical. Lower values allow for more "dynamic" tracking, suitable for fast-paced social environments like online chat rooms.
Critical Analysis & Future Outlook
GED represents a significant step from structural analysis to semantic evolution. By allowing any centrality measure (PageRank, Betweenness, etc.) to be plugged into the quality component, it creates a modular framework.
Limitations:
- The method currently relies on a pre-defined community detection algorithm; if the initial clustering is poor, the evolution tracking will suffer.
- It treats "Dissolving" and "Forming" as discrete events, whereas some groups might simply go "dormant" and reappear later—a nuance the authors acknowledge needs further research.
In conclusion, GED moves the field of Social Network Analysis closer to understanding the actual life of a group, providing the tools needed to predict community stability and churn in an increasingly connected world.