
Seeing in Context: Decoding Traditional Information Practices in Rural Bangladesh
Seeing in Context: Traditional Visual Communication Practices in Rural Bangladesh
This ethnographic study investigates traditional visual communication in rural Bangladesh, focusing on three practices: Nakshi-Katha makers, Hindu idol crafters, and witchcraft practitioners. It identifies how these communities use concrete, culturally-situated representations for record-keeping and decision-making, challenging the universalist "scientific rationality" of modern HCI.
TL;DR
In the push for global digitization, we often assume that a bar chart or a scatter plot is a "universal" language. This paper argues that such an assumption is a form of Western ideological hegemony. By studying rural Bangladeshi artisans and practitioners, the researchers reveal a sophisticated "situated visualization literacy" that relies on concrete objects, specific physical media, and local geography—elements that modern HCI currently ignores.
The Problem: The "Scientific Rationality" Trap
Most modern Human-Computer Interaction (HCI) and Information Visualization (InfoVis) tools are built on the bedrock of scientific rationality. We believe that data is most "useful" when it is abstracted, aggregated, and rendered agnostic of its medium or location.
However, for low-income and low-literate communities in the Global South, this abstraction is not just confusing—it’s culturally alien. Previous work has often labeled these users as "illiterate" in visualization. Sultana et al. flip the script, suggesting the problem isn't a lack of literacy, but a mismatch of rationalities.
Methodology: Beyond the Screen
The authors moved away from usability labs and instead embedded themselves in rural Jessore, Bangladesh. They focused on three distinct practitioner groups:
- Nakshi-Katha Makers: Women creating traditional embroidered quilts that double as family logs and narrative records.
- Hindu Idol Makers: Craftsmen who encode complex religious hierarchies into physical statues.
- Witchcraft Practitioners: Local healers who use visual amulets (Tabiz) and symbols to diagnose and treat social/physical ailments.
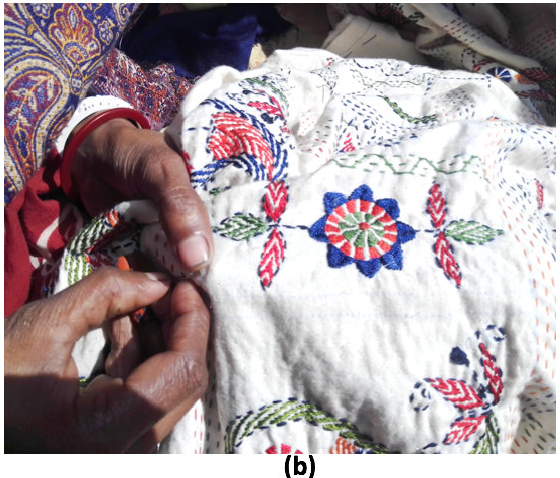 Figure 1: Traditional Nakshi-Katha makers in Jessore.
Key Insights: How "Situated Literacy" Works
1. Concreteness vs. Abstraction
While a Western chart uses a "dot" to represent a person, rural practitioners use concrete units. In Nakshi-Katha, a rat depicted as larger than an elephant isn't a scaling error—it’s a data point indicating the severity of a pest infestation that year.
2. The Medium is the Message
In digital systems, we don't care if a chart is on an iPhone or a Dell monitor. In traditional practices, the medium is critical.
- Religious Rules: A Goddess Durga idol must be made from specific mixtures of mud (e.g., from 11 different sources) to be "valid."
- Gendered Media: A spell-bound ring for a businessman works on brass for men, but silver for women. The physical material itself is a carrier of information efficacy.
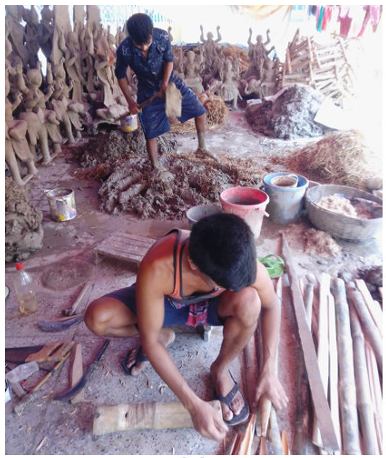 Figure 2: The complex, multi-stage process of Hindu Idol crafting (Thakur-Gora).
3. Provenance and Place
Digital data is "everywhere and nowhere." Traditional visuals are situated.
- The Storyteller: A quilt’s meaning changes based on which grandmother made it; the "signature" is in the stitch style.
- Geography: Witchcraft "investigation" symbols (Jantras) are literally oriented toward physical neighbor's houses. If the witch doesn't know the local neighborhood map, the "data" becomes unreadable.
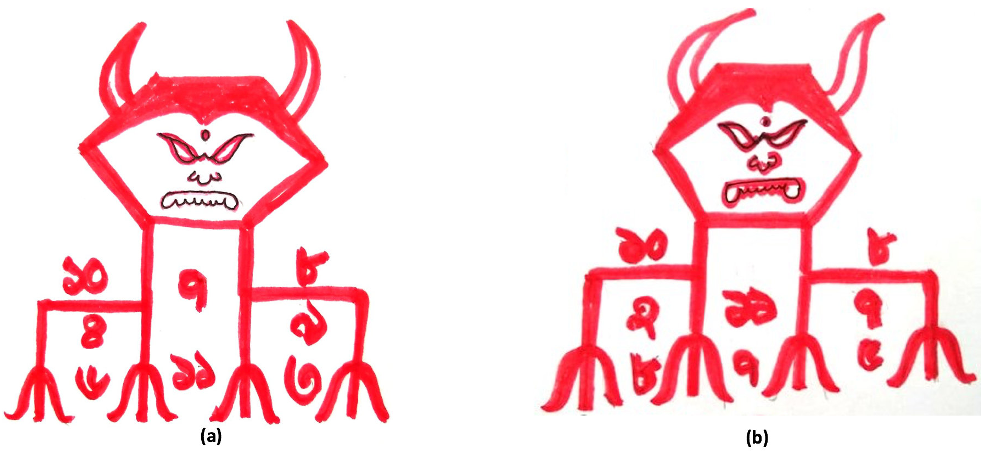 Figure 3: Jantras used to identify suspect neighbors, where the visual "trident" points to actual physical locations.
Critical Analysis & Future Outlook
This paper is a significant contribution to Postcolonial Computing. It highlights that by trying to "educate" users to understand Western graphs, we might be ignoring powerful, existing communication frameworks.
Takeaway for Designers:
- Stop Universalizing: Consider "bricolage" designs that allow users to integrate local icons and meanings.
- Materiality Matters: Explore how tangibles and local media (textiles, clay-like textures) can make data "real" for these communities.
- The Literacy Gap is a Design Gap: If a user doesn't understand your chart, it’s not because they are "information poor"—it's because your design is "context poor."
Limitations: As an ethnographic study in a specific region (Jessore), the specific visual symbols found here (like "Anarashi" stitches) don't necessarily apply elsewhere. However, the principle of situated literacy is a universal lesson for global tech.
Conclusion
The future of accessible HCI lies not just in simpler interfaces, but in a humbler approach to design—one that "sees in context" and respects the rich, traditional grammars that have survived for generations.