
Modeling the Surge: How Epidemic Interference Destroys Network Capacity
Traffic Congestion in Social Networks Caused by Epidemic Interference
The paper introduces a mathematical framework to model traffic congestion in social networks during "epidemic interference" events—sudden spikes in user activity. By employing Itô stochastic calculus, the author derives a non-stationary model for interference power, ultimately establishing an upper bound for channel capacity under these strenuous conditions.
TL;DR
When everyone joins a social network at once—think breaking news or global events—networks don't just slow down; they enter a state of "epidemic interference." This paper replaces traditional stationary math with Itô Stochastic Calculus to prove that under these conditions, interference follows a heavy-tailed Lognormal distribution, drastically reducing the theoretical capacity of the channel compared to normal operating states.
Background: The Failure of Stationarity
In standard telecommunications theory, we often assume "stationarity." We treat network noise as a predictable, Gaussian background hum. However, human behavior is anything but predictable. In social networks, a sudden urge to disseminate information causes a non-stationary spike. The author argues that in these "epidemic" moments, the interference depends directly on the current state of the network—the more people are already calling, the faster the interference grows for the next person trying to connect.
Methodology: The Itô Calculus Approach
To capture this volatility, the paper moves away from static probability and toward Stochastic Differential Equations (SDEs). The model assumes that the power variation is proportional to the current power and a Wiener process (representing channel variability).
The Core Model Architecture
The growth of interference is defined by the General Itô Equation: Where:
- (Drift): The trend or systematic growth of interference.
- (Dispersion): The volatility or "randomness" of the spike.
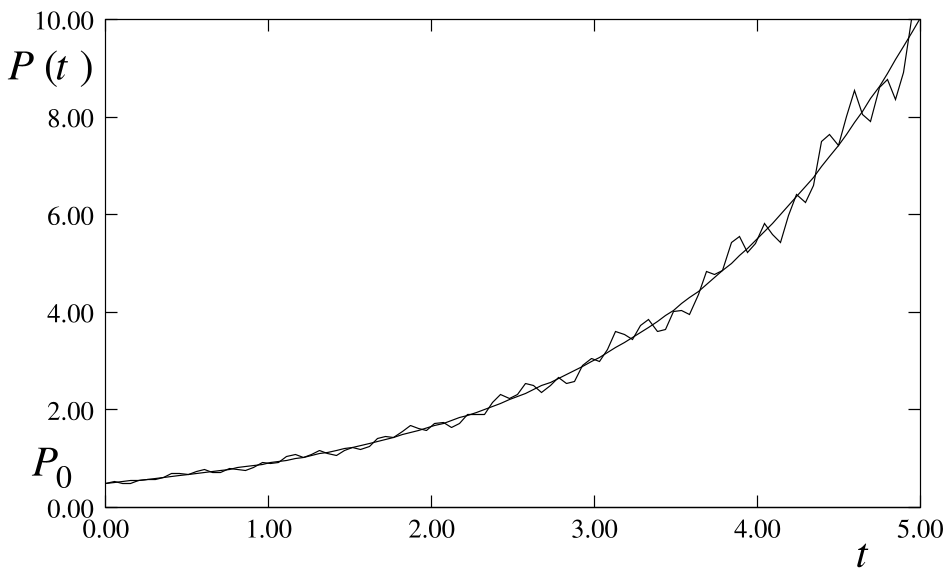 Fig 1: The solid line shows the exponential "drift" in average power, while the erratic fluctuations represent the stochastic reality users experience.
By solving this SDE, the author clarifies a vital distinction: while the underlying noise factors might be Gaussian (via the Central Limit Theorem), the resulting power is Lognormal. This is a "heavy-tail" distribution, meaning extreme interference events are much more likely than standard models suggest.
Results: The Capacity Crunch
How does this affect the actual data rate? Using a BPSK (Binary Phase Shift Keying) signal as a benchmark, the author calculates the Asymptotic Capacity.
Because the Lognormal distribution is asymmetrical and decays slowly, the interference from one signal symbol (e.g., "-A") can heavily overwhelm its neighbor ("A") in the signal space.
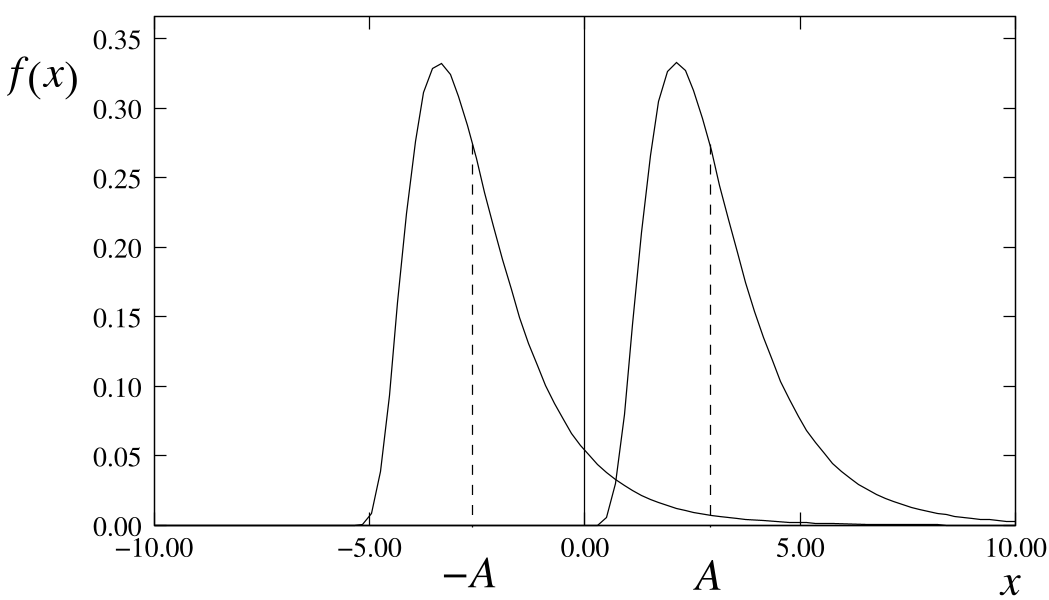 Fig 2: Asymmetry in interference distribution. Notice how the heavy tail of the Lognormal PDF causes massive overlap between symbols.
The Upper Bound Formula
The research derives a crucial upper bound for the capacity-to-bandwidth ratio (): This formula quantitatively proves that as the rate of exponential growth () or the channel volatility () increases, the available capacity drops significantly.
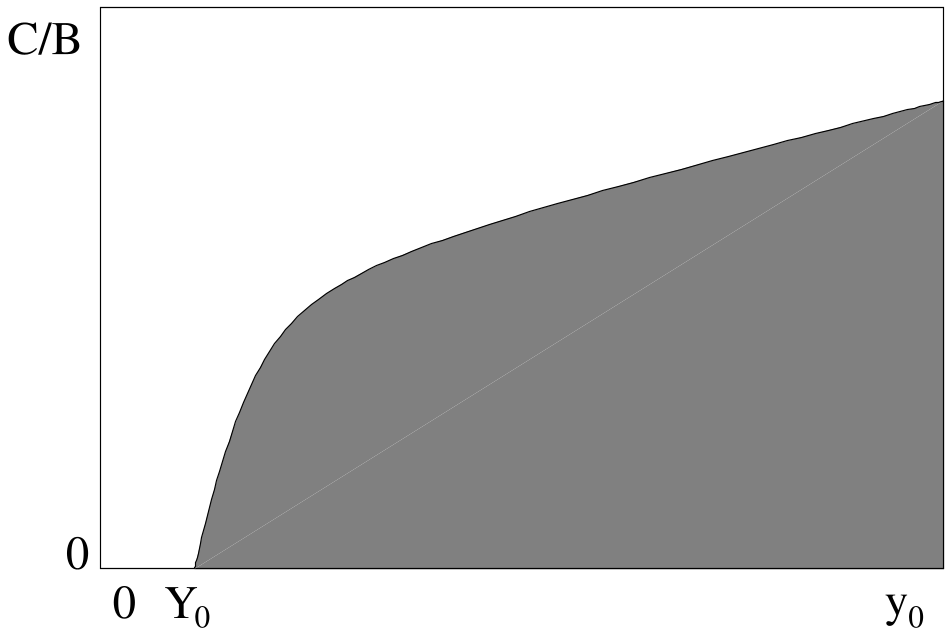 Fig 3: The declining curve illustrating the drop in capacity as interference parameters worsen.
Critical Insight & Conclusion
This work highlights a dangerous blind spot in network planning. Most systems are designed for the "average" case, but social networks live and die by their "edge" cases—the bursts and outbreaks. By proving that interference in these scenarios is Lognormal, the author provides a roadmap for more resilient Automatic Gain Control (AGC) and modulation schemes that can survive a "digital epidemic."
Future Outlook: While this study focuses on BPSK, the math lays the groundwork for analyzing higher-order modulations like M-QAM, which are standard in 5G. The next step for the industry is to see if we can adaptively adjust modulation parameters in real-time as the Itô drift begins to climb.