
TOPR: Rethinking Data Placement in Social Media via Joint Partitioning and Replication
Traffic-Optimized Data Placement for Social Media
This paper introduces TOPR (Traffic-Optimized Partitioning and Replication), a joint optimization framework designed to minimize inter-server traffic in distributed social media storage. By integrating social-aware data partitioning with adaptive replication based on real-time read/write rates, TOPR achieves state-of-the-art performance in reducing both network traffic and storage overhead.
TL;DR
Social media platforms face a massive scalability challenge: how to store petabytes of user data across server clusters while minimizing the internal traffic spent fetching friends' updates. This paper proposes TOPR, a system that jointly optimizes where data is mastered (partitioning) and where it is copied (replication). By analytical modeling of read vs. write costs, TOPR reduces inter-server traffic by up to 89% compared to traditional industry-standard hashing methods.
Background: The Social Locality Paradox
Modern distributed databases like Apache Cassandra often rely on consistent hashing. While great for load balancing, hashing is "socially blind." In social media, your data access is highly localized: you mostly look at your friends' posts. If your data is on Server A and your 100 friends are scattered across Servers B through Z, every login triggers a storm of inter-server requests.
Previous attempts to fix this, like SPAR, tried to achieve "perfect locality" by replicating all your friends' data onto your server. However, this creates a new nightmare: Synchronization Traffic. Every time a friend updates their status, the system must update every single replica, potentially generating more traffic than the original "socially blind" approach.
The Core Insight: Performance is a Zero-Sum Game
The authors of TOPR argue that partitioning and replication cannot be solved in isolation. Their breakthrough is a unified objective function that minimizes:
- Read-incurred Traffic: The cost of fetching data from another server.
- Write-incurred Traffic: The cost of synchronizing slave replicas when a master is updated.
The "Physical Intuition" here is simple: Replicate only if (Read Rate × Data Size) > (Write Rate × Data Size).
Methodology: The TOPR Framework
TOPR operates through two main mechanisms that continuously adapt to the social graph's dynamics:
1. Joint Optimization Logic
Instead of just placing data nearby, TOPR looks at the behavior of the "Inverse Neighbors" (followers).
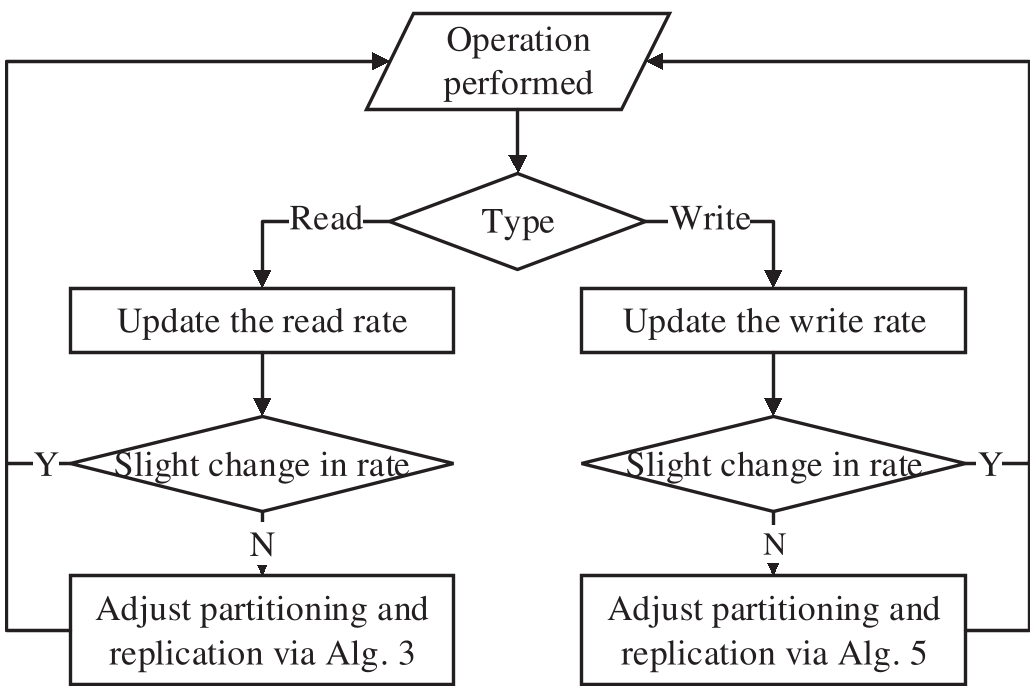 Figure 1: The TOPR Workflow - Balancing Master placement and Slave replication.
2. Adaptive Movements
- Read-Triggered: When User A reads User B's data, TOPR calculates if it’s cheaper to: (a) create a slave replica, (b) move A's master to B's server, or (c) move B's master to A's server.
- Write-Triggered: When User A updates data, TOPR evaluates if A's master replica is in the best location to minimize synchronization with its most active slave servers.
To avoid "thrashing" (moving data too often), they implement Guard Thresholds. Adjustments are only made if the traffic reduction exceeds a certain percentage, significantly reducing CPU overhead.
Experimental Results: Slicing the Traffic
The researchers tested TOPR against real-world social graphs from Twitter (81k nodes) and LiveJournal (4.8M nodes).
Performance vs. The "Gold Standard"
In smaller synthetic tests where an absolute mathematical optimum (BLP) could be calculated, TOPR's heuristic performed remarkably close to the theoretical limit.
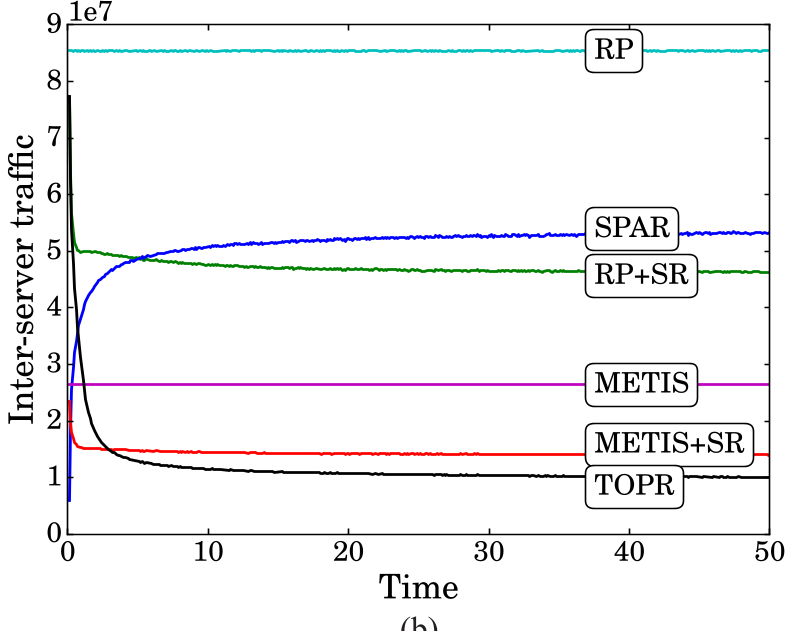 Figure 2: Inter-server traffic comparison. Note how TOPR stays nearly as low as the BLP Optimum.
The Cost of Synchronization
The study highlights the failure of the "Perfect Locality" (SPAR) approach. When write-to-read ratios increase (e.g., users post often but read less), SPAR's traffic explodes because it is forced to replicate data regardless of cost. TOPR, however, remains robust by simply shedding replicas that become too expensive to maintain.
| Method | Twitter Traffic Reduction (vs RP) | LiveJournal Traffic Reduction (vs RP) |
|---|---|---|
| METIS | ~13% | ~69% |
| SPAR | ~58% | ~37% |
| TOPR | ~95% | ~88% |
Critical Analysis & Conclusion
Takeaway
TOPR effectively proves that "more replication" is not always "better performance." By treating data placement as a dynamic balancing act between read-fetch and write-sync, it provides a blueprint for next-generation social storage.
Limitations
While the paper addresses traffic and server capacity, it assumes a Relay Model (where the server fetches data for the user). In a Redirect Model (where the client is told to go elsewhere), the bottlenecks might shift from bandwidth to connection handshake latency, which isn't the primary focus here.
Future Outlook
As social media shifts towards video-heavy content (high and ), the data sizes in the formulas will grow. TOPR’s ability to handle asymmetric data sizes makes it a strong candidate for modern platforms like TikTok or Instagram, where a "post" is 1000x larger than a "like."