
Deciphering the Digital Soul: How GPS Traces Reveal Depressive States
Trajectories of Depression: Unobtrusive Monitoring of Depressive States by means of Smartphone Mobility Traces Analysis
This paper introduces a method for the unobtrusive monitoring of depressive states by analyzing GPS-based mobility traces from smartphones. Using the "MoodTraces" app and PHQ-8 assessments, the study establishes a significant correlation between human movement patterns and depression severity, enabling predictive modeling of mental health changes.
TL;DR
In a breakthrough for "Digital Phenotyping," researchers have demonstrated that your smartphone's GPS data can act as a silent monitor for depression. By analyzing movement patterns—not just where you go, but the routine and span of your life—researchers can predict spikes in depressive symptoms with over 85% specificity, without asking the user a single question.
The Motivation: Moving Beyond Self-Reporting
Clinical psychology has long been haunted by the "subjectivity gap." Diagnosing and monitoring depression currently depends on patients' memories and their willingness to fill out surveys. This is inherently flawed: the more depressed an individual is, the less likely they are to engage with a tracking app.
The authors of Trajectories of Depression pivoted to a more objective source: Passive Mobility Data. The intuition is simple—depression often manifests physically as reduced activity, social withdrawal, and a breakdown of daily routines. If we can quantify these "trajectories," we can detect the onset of a depressive episode before the patient even realizes it.
Methodology: Quantifying Life in Latitudes and Longitudes
The researchers faced two major hurdles: battery life and translating raw GPS pings into psychological meaning.
1. The Energy-Efficient Sensor
Continuous GPS drains a phone in hours. The authors designed a state-machine (Static, Moving, Undecided) that only activates high-power GPS when the accelerometer detects movement.
2. The Mobility Metrics
The core of the paper lies in eight mathematical metrics designed to capture the "physical signature" of depression:
- Radius of Gyration (): How much space the user occupies daily.
- Routine Index (): How much today's path deviates from the user's historical average.
- Significant Places (): The variety of frequented locations (work, gym, cafe).
 Figure 1: The temporal relationship between the sensing window () and the prediction target ().
Proving the Link: Can Machines Sense Sadness?
The study deployed the MoodTraces app to 28 users over several months. By correlating these mobility metrics with PHQ-8 (Patient Health Questionnaire) scores, the results were striking.
Correlation vs. Duration
The research found that short-term data (1 day) is a poor predictor. However, over a 14-day window, the correlation coefficients jumped significantly. Distance-based metrics like Maximum Distance () and Routine Index () emerged as the strongest signals.
Personalized vs. General Models
Everyone "depresses" differently. For some, it means staying home; for others, it means aimless wandering or a loss of routine. The paper shows that personalized SVM models (trained on an individual's own history) outperform generalized models, though even generalized models showed surprising efficacy.
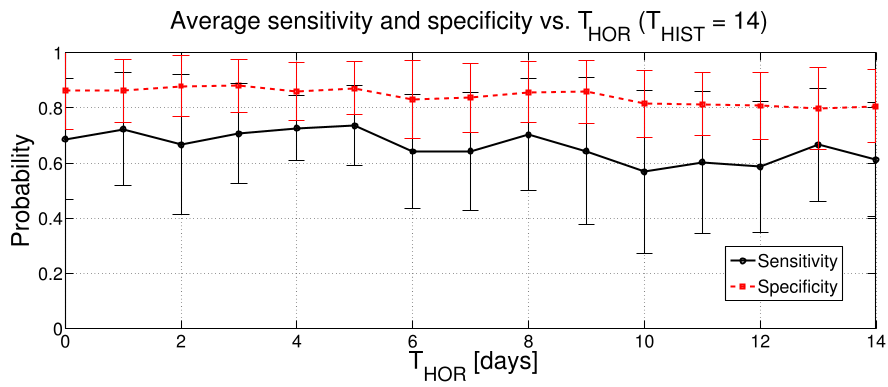 Figure 2: Performance metrics (Sensitivity and Specificity) showing the high predictive power of personalized models over a 14-day history ().
Deep Insights & The Future of Intervention
The most profound finding is the "Prediction Horizon." The models could predict depressive mood shifts even 14 days in advance with reasonable accuracy. This suggests that changes in our physical mobility are "early warning signals" that precede the psychological realization of a depressive dip.
Critical Analysis:
- Privacy vs. Utility: While the system is unobtrusive, GPS tracking is the most sensitive data a user can provide. The social and ethical guardrails for such systems are still in their infancy.
- Context Blindness: A "loss of routine" or "staying home" could be caused by the flu or bad weather, not just depression. Future models need to integrate weather and health data to reduce false positives.
Conclusion
This work transitions mental health care from reactive to proactive. By turning a device we already carry into a clinical-grade diagnostic tool, we open the door to a world where your phone can suggest a walk or alert a caregiver precisely when the "trajectories of depression" begin to dip.
Takeaway: Mobility isn't just about travel; it's a mirror of mental state. High-resolution GPS analysis is no longer just for navigation—it’s for healing.