
Deciphering the Pulse of Cattle: Trend Mining in Large-Scale Spatio-Temporal Networks
Trend Mining in Social Networks: A Study Using a Large Cattle Movement Database
The paper introduces TM-TFP (Trend Mining Total From Partial), a framework for detecting spatio-temporal trends in social networks. Evaluated on a massive UK cattle movement database, it leverages Frequent Pattern Mining (FPM) combined with Self-Organizing Maps (SOM) to cluster and visualize complex behavioral shifts over time.
TL;DR
This paper presents a robust framework for identifying and visualizing trends within massive social networks where nodes represent physical locations and links represent movements over time. By combining the TM-TFP algorithm for pattern extraction and Self-Organizing Maps (SOM) for cluster visualization, the authors transform millions of raw cattle movement records into intuitive "trend maps" that highlight seasonal shifts and anomalies in livestock logistics.
The Challenge: Missing the "Time and Space" in Networks
Most social network analysis (SNA) treats data as a static snapshot. In the real world, connections between nodes—whether people, servers, or farms—flicker and pulse over time. In the context of the UK’s cattle movement database, knowing who moved cows where is only half the battle; the real value lies in understanding the dynamics:
- Temporal Decay: Patterns that disappear after a month.
- Spatial Constraints: Movements are often bounded by geography (Easting/Northing).
- Result Explosion: Mining frequent patterns in large datasets often leads to thousands of results, creating a "data graveyard" where insights are buried under volume.
Methodology: From Patterns to Trend Lines
The authors propose a two-stage pipeline: Mining followed by Visualizing.
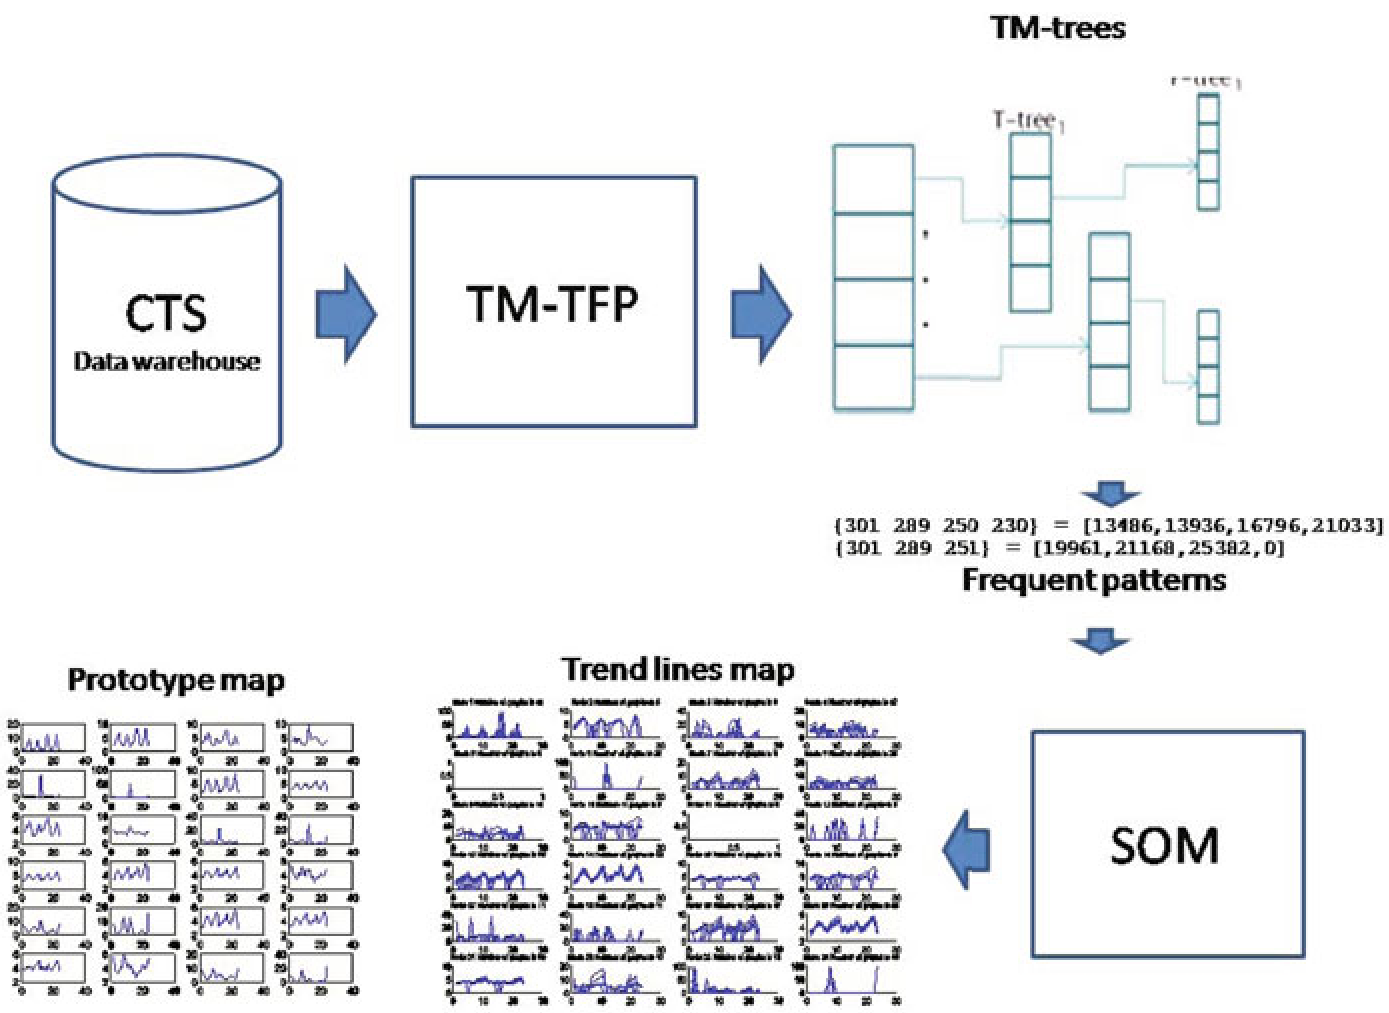
1. TM-TFP (Trend Mining - Total From Partial)
The core engine is based on the TFP algorithm, which utilizes efficient tree structures (P-tree for partial counts and T-tree for fast lookups). The authors extended this into TM-TFP, which generates a "trend line" for every frequent pattern.
If a pattern like {Breed: British Friesian, Source: Area B, Destination: Area D} appears across 24 months, its support (frequency) is recorded as a time-series vector.
2. SOM: Dimensionality Reduction for Sanity
To solve the "too many patterns" problem, the authors use a Self-Organizing Map (SOM). Unlike K-Means, SOM preserves the topology of the data.
- Input: The high-dimensional trend lines.
- Output: A 2D grid where nodes in the top-left might represent "constantly increasing" trends, while the lower-right might represent "highly seasonal" noise.
Experiments & Results: Mapping Great Britain's Livestock
The system was tested on the UK Cattle Tracing System (CTS), involving roughly 400,000 movement records per month.
Quantitative Performance
As shown in the evaluation, the TM-TFP algorithm maintains linear scalability relative to the temporal window:
| Duration (Months) | Support 2% (Lines) | Runtime (Seconds) |
|---|---|---|
| 6 | 1993 | 39.52 |
| 24 | 2204 | 156.96 |
Visual Insights
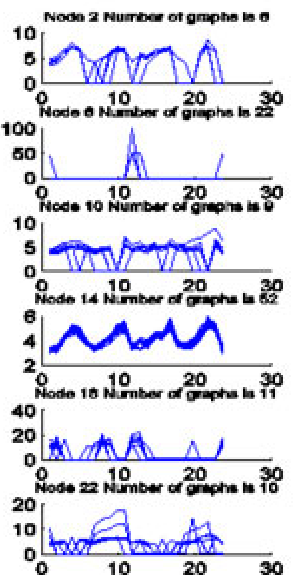
The SOM visualization (6x4 grid) allowed researchers to see "Prototype Trends." For instance:
- Cluster 10: Contained 360 trends, representing the most stable, frequent movements.
- Ablation of Support: The study found that while lower support (S=2%) reveals more "hidden" patterns, the core prototypes remain consistent even at higher thresholds (S=8%), suggesting the network has strong dominant behaviors.
Critical Insight: Why This Matters
The elegance of this work lies in its Inductive Bias. By grouping geography into grids and time into monthly snapshots, the authors provide a structured way to look at "Dynamic SNA."
Limitations:
- The discretization of geography into fixed grid squares might suffer from "edge effects" (where two close farms are separated by a grid line).
- The approach is unsupervised; while it groups similar trends, it doesn't automatically label which ones are "risky" (e.g., potential disease super-spreaders).
Conclusion
This paper moves social network mining from "Who is important?" to "How are they changing?". For practitioners in epidemiology, logistics, or even retail, the TM-TFP + SOM framework provides a blueprint for turning time-stamped transaction logs into a map of strategic behavior.
Next Steps: Applying this to real-time streaming data or integrating Graph Neural Networks (GNNs) could further refine the spatial relationships that grid-sharding currently handles.