
IGCV Framework: Decoding the "Traffic" of Trends in Dynamic Social Networks
Trend Mining and Visualisation in Social Networks
The paper introduces IGCV (Identification, Grouping, Clustering, and Visualisation), a four-stage framework designed for temporal trend mining in social networks. It utilizes a novel combination of the TM-TFP algorithm for pattern identification and Self-Organizing Maps (SOM) coupled with Newman's modularity clustering to visualize "traffic movement" patterns over time, specifically validated on a large-scale UK cattle movement dataset.
TL;DR
The IGCV framework (Identification, Grouping, Clustering, and Visualisation) is an end-to-end pipeline designed to tackle the "volume explosion" in social network trend mining. By combining the TM-TFP pattern discovery algorithm with Self-Organizing Maps (SOM) and Newman clustering, it transforms raw timestamped transaction data—such as national cattle movements—into intuitive, animated "islands" of behavioral trends.
Background & Positioning
Most social network analysis is a static affair, treating relationships as a single snapshot in time. However, real-world networks are fluid; they have "traffic" that fluctuates. The researchers behind IGCV position their work as a bridge between high-throughput data mining and human-centric visualization, moving beyond simply finding "who is connected" to understanding "how behaviors evolve."
The Core Problem: The Paradox of Choice in Trend Mining
The authors identify a critical bottleneck: Scale vs. Interpretability.
- Scale: Modern datasets, like the UK Cattle Tracing System (CTS), are massive (155GB+).
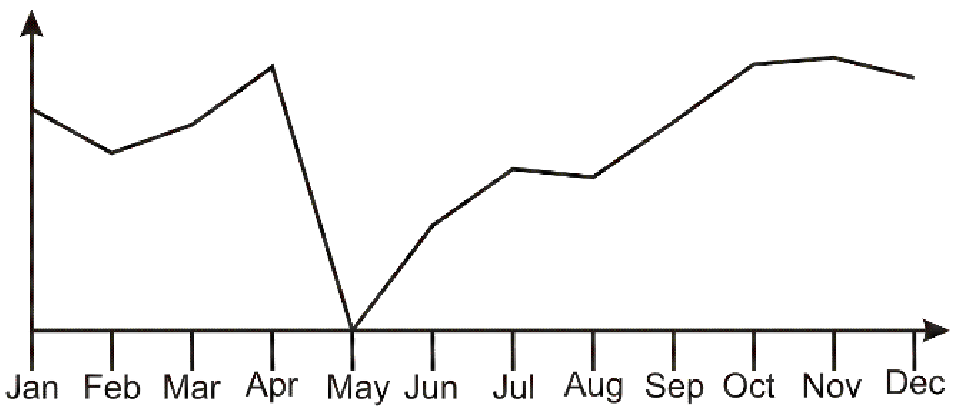
- Interpretability: Standard mining algorithms often output over 60,000 "frequent patterns" for a single year. Without a way to group these patterns by their "shape" (e.g., patterns that peak in spring versus those that are stable year-round), the data remains noise.
Methodology: The Four Pillars of IGCV
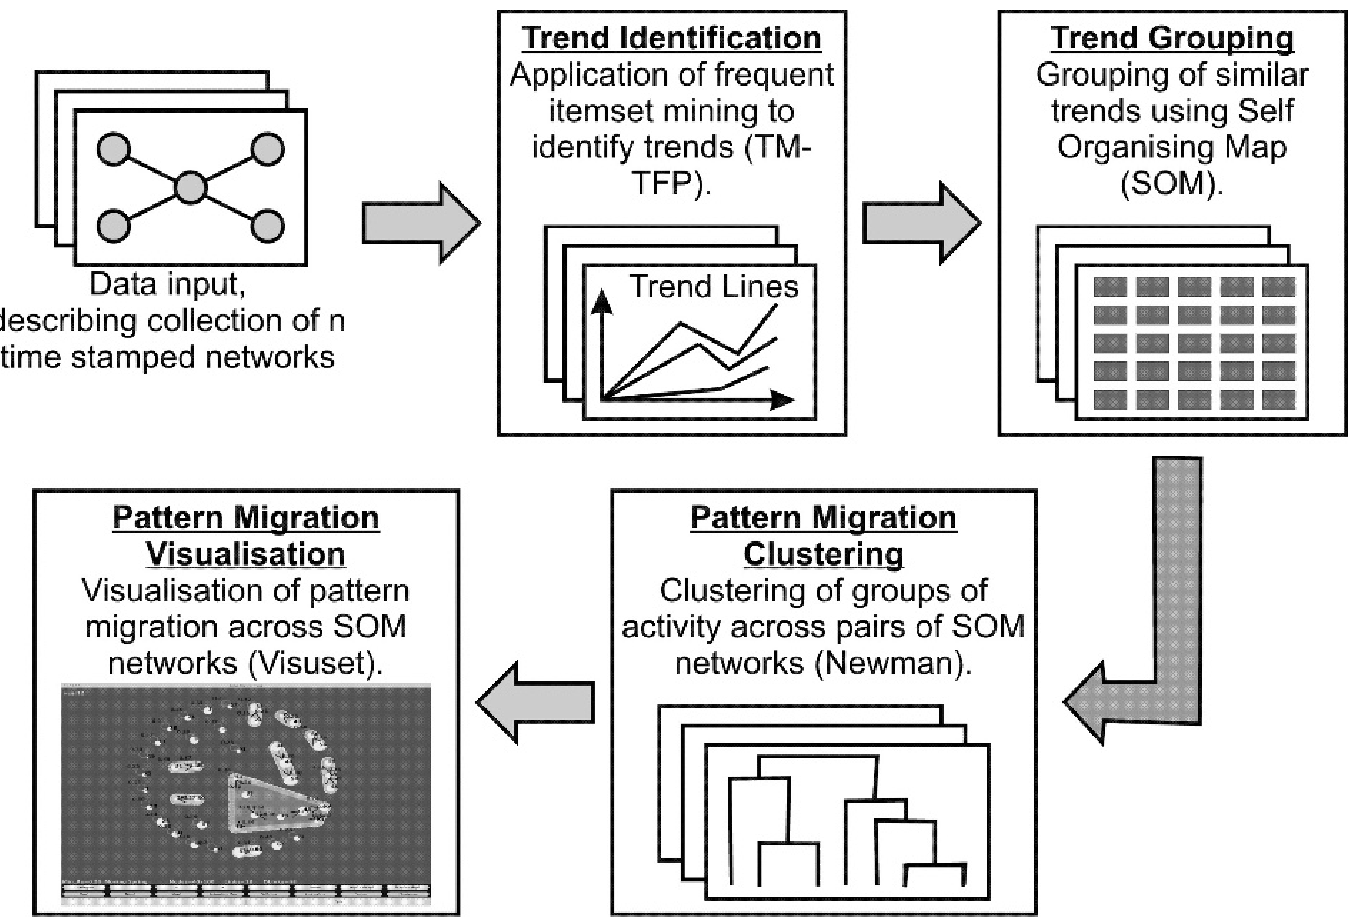
1. Trend Identification (TM-TFP)
The framework utilizes TM-TFP (Trend Mining Total From Partial). It uses a P-tree to encapsulate data and a T-tree (a reverse set enumeration tree) for fast frequency counting. This setup allows the system to track how the frequency of specific "attribute sets" changes across monthly timestamps.
2. Trend Grouping (SOM)
To manage the thousands of trend lines, the authors use a Self-Organizing Map (SOM).
- Insight: Similar trend "profiles" (e.g., seasonal peaks) are mapped to adjacent nodes on a 10x10 grid.
- This effectively collapses 60,000+ patterns into 100 representative "trend types."
3. Pattern Migration Clustering
The most innovative step is identifying Migration. If a group of patterns belongs to "Trend A" in 2003 but moves to "Trend B" in 2004, what does that mean? IGCV uses the Newman Method for community detection to find "islands" of nodes where these transitions are most frequent.
4. Visualisation (Visuset & Spring Model)
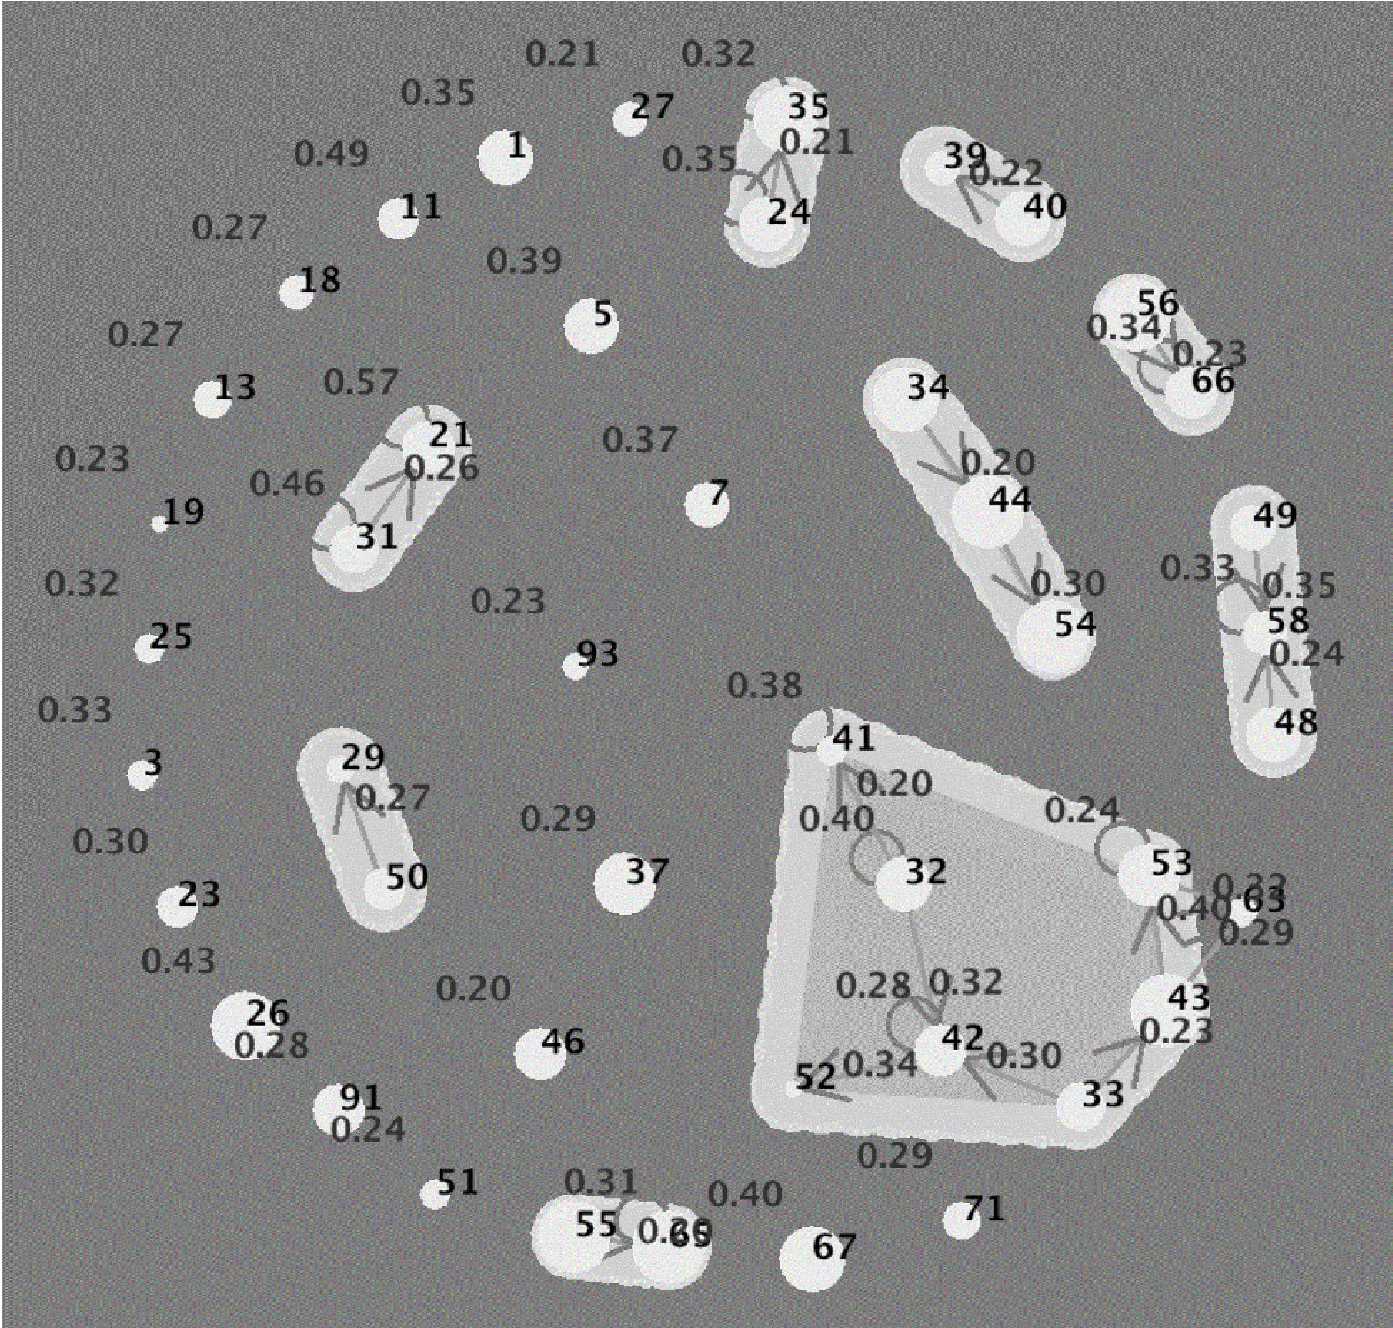
Using a Spring Model, the system draws a graph where nodes are trend clusters. "Stronger" migrations act as tighter springs, pulling related clusters together.
Experiments: Tracking the UK Cattle Industry
The framework was tested on the Cattle Tracing System (CTS), tracking 400,000 movements per year.
- Findings: The SOM successfully identified seasonal variations where cattle movements increased in March, June, and October.
- Analysis: By visualizing the migration between 2003 and 2004, the authors found that while many patterns were stable (self-links), specific shifts occurred (e.g., migration from node 34 to 44), signaling subtle changes in industry logistics.
Critical Perspective: Takeaways and Limitations
Value: IGCV provides a structured way to handle the temporal dimension of social networks, which is often ignored in favor of topology. The use of animation to show "appearing" (pink) and "disappearing" (white) trends is a high-value feature for domain experts.
Limitations:
- Threshold Sensitivity: The results are highly dependent on the "Min-Rel" (Minimum Relationship) and "Support" thresholds.
- Grid Constraints: The 10x10 SOM size was chosen empirically; a more dynamic or hierarchical SOM might handle even more complex data variations better.
Conclusion
The IGCV framework proves that the future of social network mining isn't just in "finding more patterns," but in filtering and animating them so that the "traffic" of human (or bovine) activity becomes visible to the naked eye.