
TV Goes Social: Decoding the Hidden Patterns of the Digital Living Room
TV Goes Social: Characterizing User Interaction in an Online Social Network for TV Fans
2015-01-01
Summary
Problem
Method
Results
Takeaways
Abstract
This paper presents a comprehensive characterization of "tvtag," a specialized Online Social Network (OSN) for television fans. By analyzing a massive dataset of 92 million check-ins and 1.2 million users, the study explores real-time user behavior, genre preferences, and social influence within the "Social TV" ecosystem.
## TL;DR
The way we watch television has shifted from a passive "lean-back" experience to an active, socially connected "lean-forward" activity. This paper analyzes **tvtag**, a now-defunct pioneer in Social TV, demonstrating that specialized social networks act as a "second screen" synchronized with live broadcasts. Crucially, the researchers prove that social signals *before* a show premieres can accurately predict its initial success.
## The Problem: The Death of the Passive Viewer
Traditional TV measurement is blind to the "second screen"—the smartphone or tablet in your hand while you watch. Generic platforms like Twitter provide a "social soundtrack," but they are noisy. The researchers wanted to know: **Can a specialized network for TV fans provide better insights into audience behavior, influence, and show popularity?**
## Methodology: Mapping the Fan Universe
The authors crawled tvtag to build two distinct graphs:
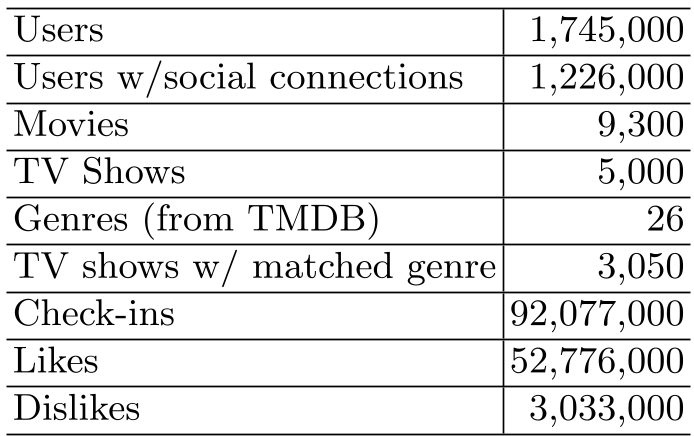
1. **The User-Interest Graph**: 92M check-ins, 52M likes, and 3M dislikes across 9,300 movies and 5,000 TV shows.
2. **The Social Graph**: Following/follower relationships among 1.2M users.
By merging this with **TMDB (The Movie Database)**, they could cross-reference check-in timestamps with actual broadcast schedules and genres.
## Key Insight 1: The "Second-Screen" is Real-Time
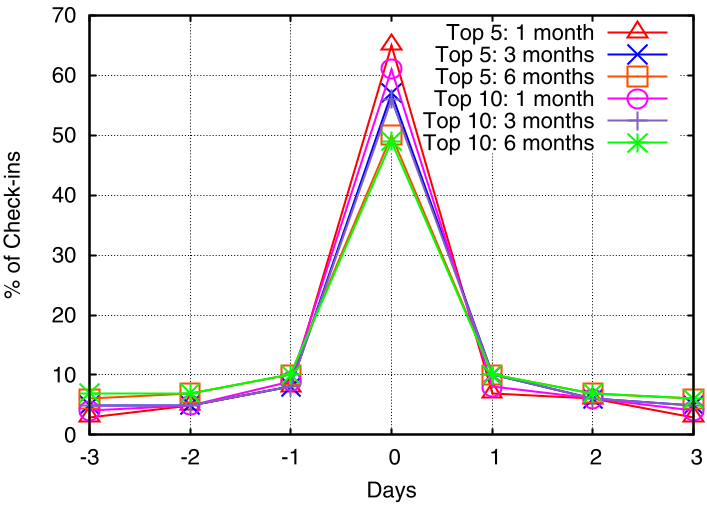
Is tvtag just a log of what people watched eventually, or is it a live companion? The data proves the latter. For the most popular 5% of shows, **65% of user check-ins occurred on the exact day of the week the show aired.** Activity peaks precisely during US primetime (23:00 to 04:00 GMT).
## Key Insight 2: The Myth of the Eclectic Influencer
Common intuition suggests that users with diverse interests (Eclecticism) would attract more followers. The study found the opposite: **The most influential users are specialists.**
- Users who followed 3-4 genres had the highest number of followers.
- "Hyper-eclectic" users (5+ genres) rarely achieved "expert" status or high follower counts.
- *Takeaway:* Expertise in specific niches drives social capital in entertainment networks.
## Key Insight 3: Predictive Power of Pre-Release "Likes"
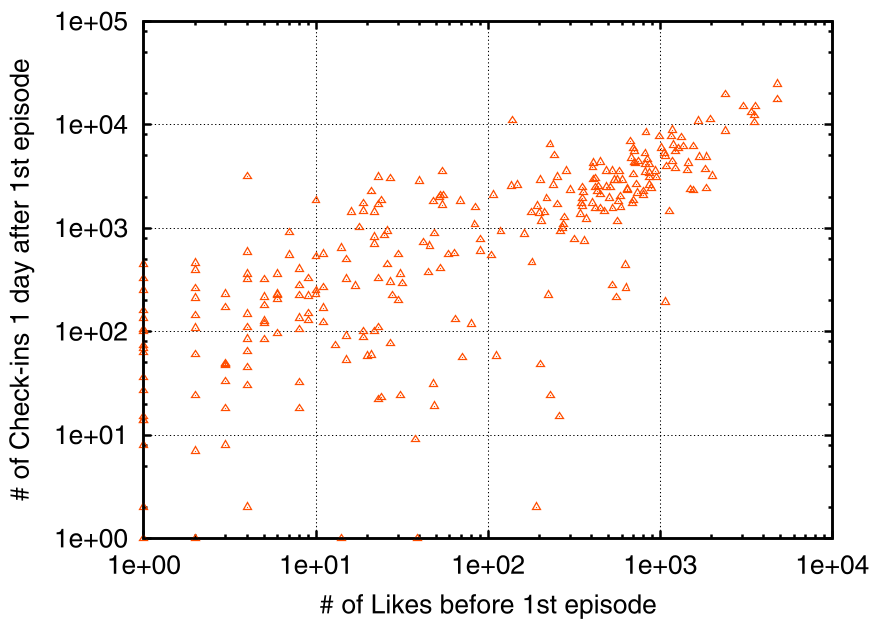
Can social media predict a hit? The authors developed a linear regression model showing a massive correlation (**ρ = 0.90**) between "likes" a show receives *before* it airs and check-ins *after* its release.
## Critical Analysis & Conclusion
**The Takeaway:** Specialized OSNs are not just mirrors of behavior; they are leading indicators. A "like" on a platform like tvtag is a declaration of intent that translates into actual viewership.
**Limitations:** The dataset is historical (tvtag shut down in 2015), and the model’s accuracy was slightly hampered by the platform's overall growth (organic network expansion vs. specific show interest).
**Future Outlook:** As streaming services (Netflix, Disney+) replace linear TV, the "air date" peak might flatten, but the need for "social synchronization" remains. Future research should look at how these patterns migrate to platforms like Reddit or Discord, where "expert" communities continue to thrive.