
Political Momentum: Decoding Election Outcomes Through Asset Price Bubble Models
Tweet sentiment as proxy for political campaign momentum
This paper introduces a novel framework for predicting political election outcomes by modeling "campaign momentum" using Twitter data. The authors propose three distinct metrics—Sentiment Indicator (SI), Curvature Indicator (CI), and Growth Indicator (GI)—and uniquely adapt a financial asset price bubble model to quantify shifts in political support during the 2014 US midterms and 2016 Presidential primaries.
TL;DR
Can a political campaign be modeled like a surging stock market bubble? This paper argues "Yes." By treating Twitter sentiment as a proxy for campaign momentum and applying financial power-law models—typically used to predict stock market crashes—the researchers demonstrate a significant correlation between sentiment acceleration and actual primary election victories.
Context: Beyond Simple Tweet Counting
Most researchers look at Twitter and ask "What is the sentiment?" or "How many retweets?" This paper shifts the perspective to Physics and Finance. The authors argue that in politics, as in markets, momentum is the ultimate decider. A candidate doesn't just need positive sentiment; they need that sentiment to be accelerating in a specific non-linear pattern to reach the "escape velocity" required for victory.
The Problem: The Static Nature of Polls
Traditional polling is often a "snapshot in time," failing to capture the kinetic energy of a movement. Prior Twitter-based research often missed the Domain Specificity of politics—specifically the fact that campaigns act as "Topic Bubbles." The researchers recognized that a winning campaign often exhibits a "faster-than-exponential" growth rate similar to a financial bubble before it peaks.
Methodology: Borrowing from Wall Street
The core innovation is the adaptation of the Johansen-Ledoit-Sornette (JLS) model for financial bubbles.
1. The Momentum Indicators
The paper proposes three hierarchical indicators:
- Sentiment Indicator (SI): The aggregate "volume" of positive vs. negative sentiment (using the AFINN lexicon).
- Curvature Indicator (CI): Calculated using numerical differentiation (). It measures whether the sentiment is accelerating (convex) or decelerating (concave).
- Growth Indicator (GI): Fits the sentiment data to a singular power law: .
2. The Model Architecture
The researchers look for the growth factor () and the curvature (). If the curvature is positive (), the campaign has structural momentum.
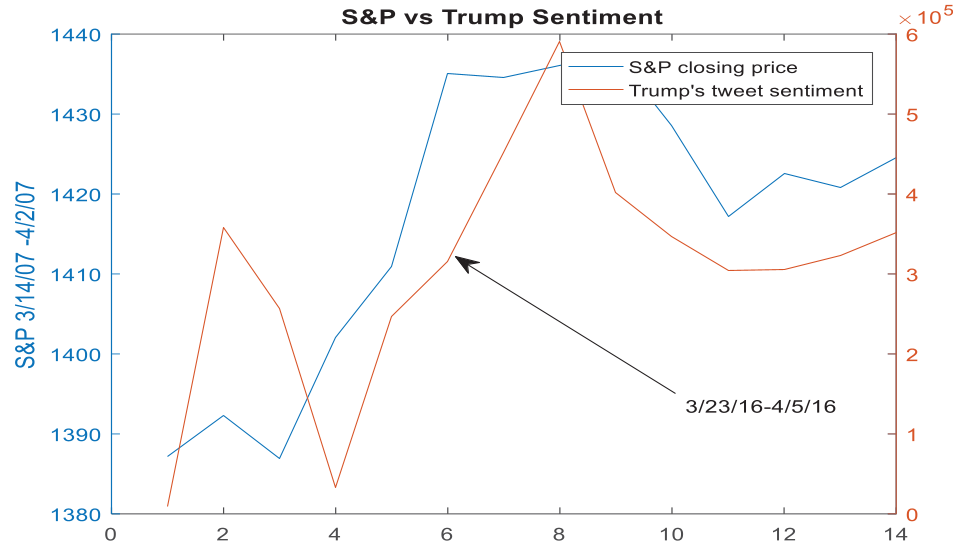 Figure 0: The author's key insight—the 0.7 correlation between Trump's sentiment growth and the 2007 S&P 500 bubble run-up.
Experimental Results: Predicting the Primaries
The authors put their indicators to the test against the 2016 US Presidential Primaries.
The Trump Factor
Across 12 Republican debates, Donald Trump consistently dominated the Sentiment Indicator (SI). While other candidates had spikes, Trump's sustained "Potential" (calculated using a diffusion model that includes retweets as speculative imitations) matched the behavior of a growing asset bubble.
Curvature as a Leading Indicator
In the New Hampshire primary, both Trump and Sanders showed positive Curvature Indicator (CI) trends leading up to their respective wins. Conversely, while Hillary Clinton had a high volume of sentiment, her CI trend was relatively flat, indicating a lack of "breakout" momentum at that specific time.
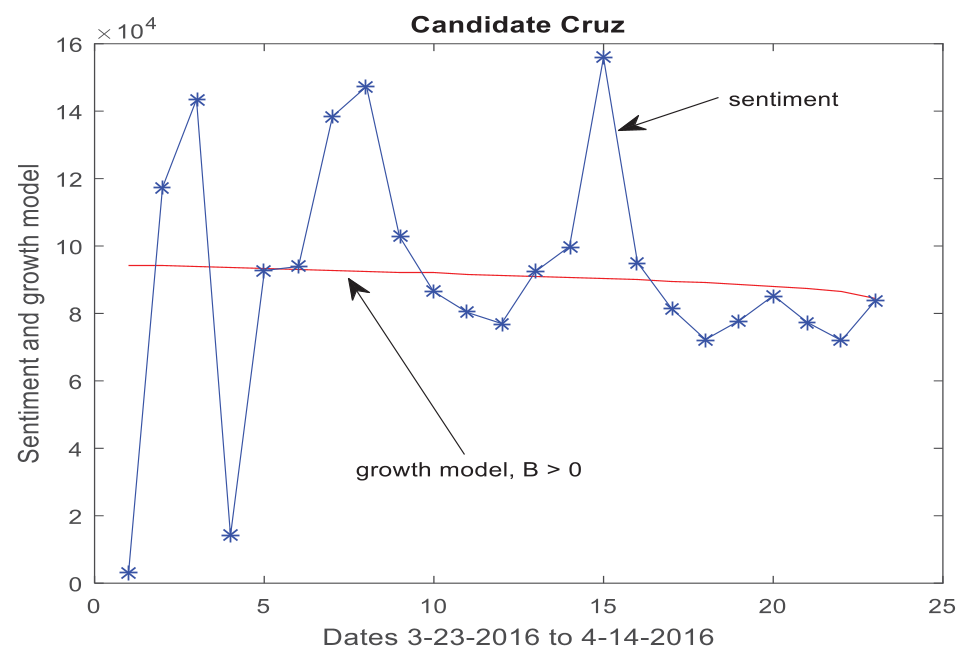 Figure 10: Quantitative alignment—the power-law model (fitted lines) closely tracking the actual sentiment trajectory of the primary winners.
Critical Insight: The "Speculative"Retweet
One fascinating takeaway is how the authors treat Retweets. They apply a Topic Diffusion Model where original tweets are "Constant Laws" and retweets are "Power Laws" . Retweets are viewed as speculative contributions to a topic’s potential. This mirrors how speculative buying drives an asset bubble higher.
Limitations & Future Outlook
While the indicators show strong ex-post validation, several challenges remain:
- Localization: Twitter sentiment is often national, making it difficult to predict specific state primaries (where a candidate might win locally despite national sentiment trends).
- Lexicon Limitations: Using the AFINN lexicon is relatively basic compared to modern LLM-based sentiment analysis, which could capture nuance (sarcasm, political slang) much better.
- The "Burst": In finance, bubbles burst. In politics, the "burst" is the election day itself. The model needs further refinement to distinguish between a healthy "momentum build" and a "peaking bubble" that may collapse before the vote.
Conclusion
This paper bridges the gap between political science and quantitative finance. By proving that political campaigns follow the same mathematical signatures as asset bubbles, it opens a new frontier for real-time atmospheric modeling of the electorate.