
#swineflu: Twitter as a Real-Time Sensor and Risk Communication Hub
#swineflu: The Use of Twier as an Early Warning and Risk Communication Tool in the 2009 Swine Flu Pandemic
This research investigates the dual role of Twitter during the 2009 H1N1 (Swine Flu) pandemic as an early warning sensor and a risk communication hub. By analyzing over 3 million tweets, the authors developed a methodology to filter "self-reporting" cases and track information propagation through URLs during major health events.
TL;DR
This seminal 2014 study analyzes the 2009 H1N1 pandemic through the lens of social media. It demonstrates that Twitter can "nowcast" disease outbreaks up to three weeks before official government statistics and identifies how information—both reputable and spam—cascades through the network during global health crises.
Background: The Latency Problem in Public Health
In public health, time is the enemy. Traditional surveillance systems (sentinel networks) require patients to visit a doctor, data to be recorded locally, and then aggregated nationally—a process that introduces a 1-2 week lag. During a pandemic like Swine Flu, this delay can be catastrophic for resource allocation.
The authors argue that social media offers a "two-way" paradigm:
- Bottom-Up: Citizens reporting symptoms in real-time.
- Top-Down: Agencies disseminating life-saving information.
Methodology: From Noise to Signal
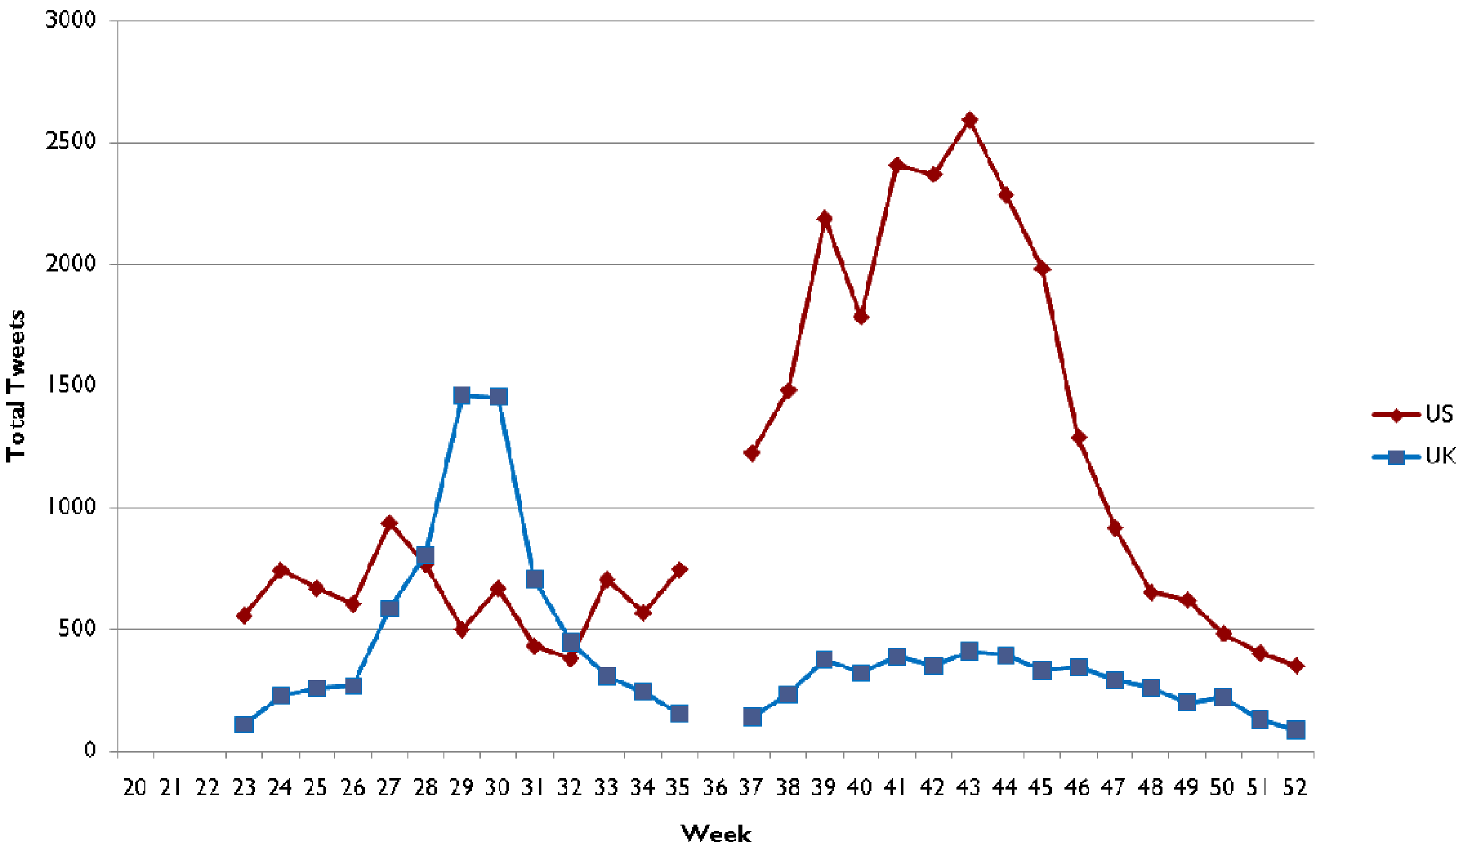
The researchers collected 3 million tweets containing the keyword "flu." The core challenge was filtering the noise: only a fraction of people tweeting about the flu actually had it.
The Early Warning Algorithm
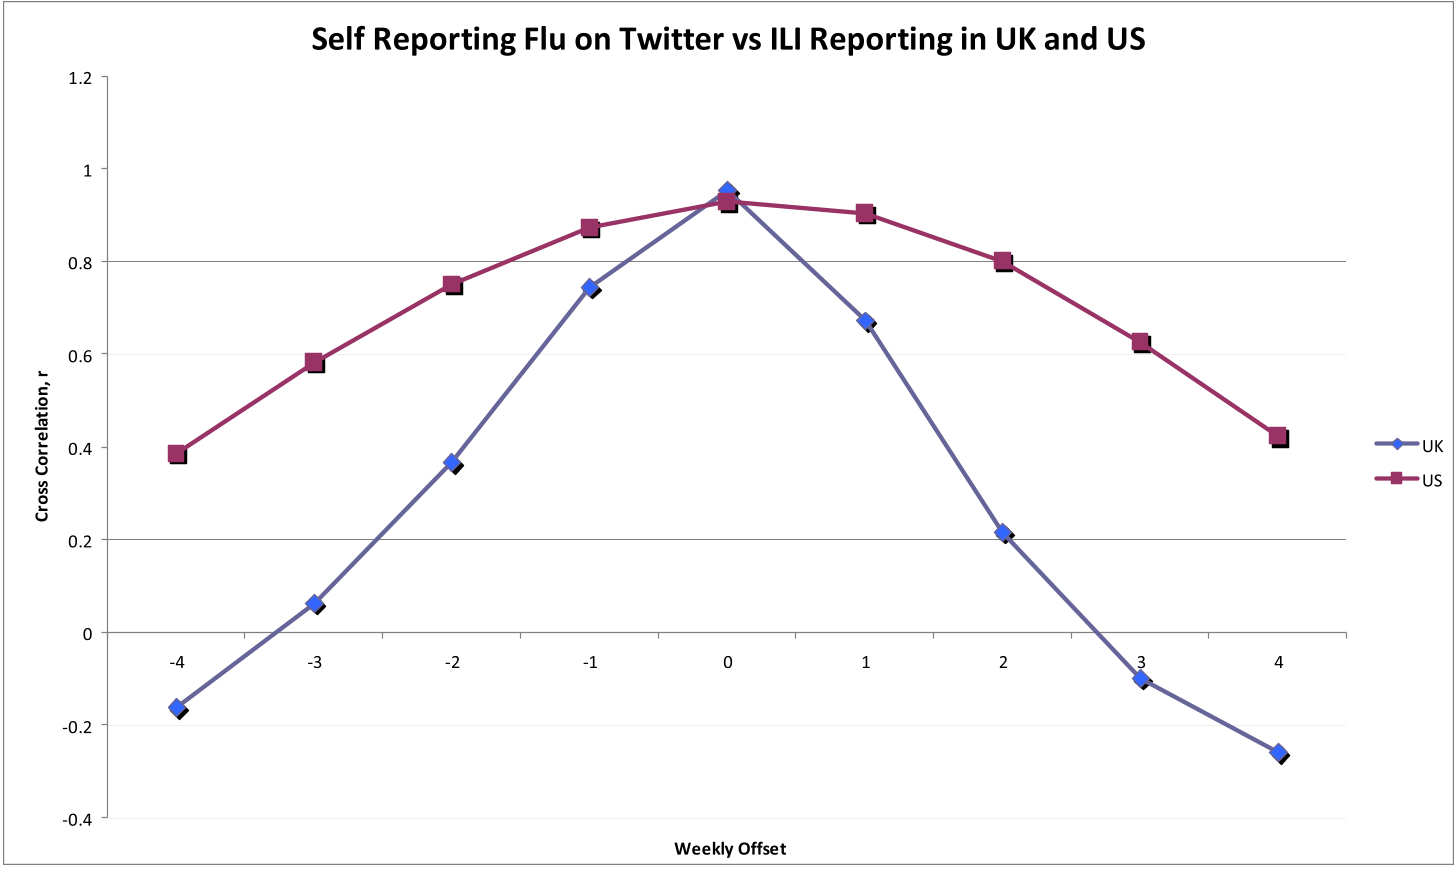
The team focused on "self-reporting" tweets (e.g., "I have the swine flu") and used Normalized Cross-Correlation to match these signals with official data from the UK's HPA and the US's CDC.
Fighting Spam and "Bogus" News
To study information flow, they analyzed 769 popular URLs. They introduced the Author-Post Ratio:
- High Ratio (near 1.0): Many different users sharing a link (Reputable).
- Low Ratio: A few users spamming the same link repeatedly (Spam).
Key Results: Beating the Clock
The findings were striking. In both the U.S. and the U.K., the "Twitter signal" mirrored the shape of the official disease curve but occurred much earlier.
- U.K. Prediction: 1-week lead time in raw data, effectively a 2-week lead when accounting for the HPA's reporting lag.
- U.S. Prediction: 2-week lead time in raw data, providing a 3-week early warning for health authorities.
The Dissemination Paradox
When the WHO officially declared the pandemic on June 11, 2009, the researchers tracked how the news traveled.
The Winner: The BBC. Although they were 4 hours late to the party compared to CNN or Reuters, their credibility made them the most shared source. The Loser: Official Public Health Agencies (WHO, CDC). Despite being the primary source of truth, their direct links were rarely shared. Twitter users preferred to consume health information through a "media filter" rather than directly from scientists.
Critical Insight: The "Quality Control" Challenge
While Twitter acts as a fast sensor, it is vulnerable. The study found that 40% of the most shared resources were spam, and anti-vaccination blogs (e.g., "Do NOT Let Your Child Get Flu Vaccine") gained significant traction. This highlights the "Infodemic" risk that would later explode during COVID-19.
Conclusion
This study transformed the way we view social media in an academic and policy context. It proved that Twitter isn't just for social updates—it's a critical infrastructure for Epidemic Intelligence. However, for this to be useful, health agencies must stop being "silent authorities" and start mastering the art of social media propagation.
Future Work: The authors suggest integrating social media behavioral modeling with traditional disease spread models to reduce false positives and create a unified "Public Health Dashboard."