
Beyond Binary Sentiment: Mining Twitter Emotions to Outsmart Election Pollsters
8326_Twitter Data for Predicting Election Results Insights from Emotion Classification.
This paper utilizes a lexicon-based emotion classifier from the National Research Council (NRC) of Canada to predict the 2016 U.S. Presidential Election results by analyzing over 25 million tweets. By calculating a "Net Positive Score" across 19 states, the method achieved a 17/19 (89.5%) accuracy rate in predicting state outcomes, outperforming several mainstream pollsters.
TL;DR
Researchers leveraged the NRC (National Research Council) emotion classifier to analyze over 25 million tweets during the 2016 U.S. election. By tracking eight distinct emotions—such as trust, disgust, and anticipation—rather than just "positive" or "negative" sentiment, they successfully predicted 17 out of 19 state outcomes, showing superior performance to traditional heavyweights like the New York Times and FiveThirtyEight in key battleground states.
The "Linguistic Noise" Problem in Social Media
Traditional sentiment analysis struggles with Twitter's inherent chaos. With a 280-character limit, users employ acronyms, slang, and unusual orthography. When these short messages are converted into feature vectors, they become highly sparse, making it difficult for standard machine learning models to identify the underlying emotional state.
Furthermore, the authors highlight the Circumplex Model of Affect, which suggests that many of the 28 distinct human emotions are clustered so closely that humans often mislabel them. This ambiguity in training data often inhibits classifiers from learning the critical features required to differentiate between "anger" and "disgust" or "joy" and "trust."
Methodology: The NRC Lexicon and SOA
To bypass human annotation errors, the study utilized EmoLex, a lexicon of over 14,000 words. The core mechanism is the Strength of Association (SOA), calculated using Pointwise Mutual Information (PMI).
The logic is intuitive: if an n-gram (a word or phrase) appears significantly more often in a sentence labeled with "Anger" than in a neutral set, it receives a higher SOA score for that emotion. By applying these scores to the massive 25-million tweet corpus, the researchers could generate a dynamic "Net Positive Score" for both Donald Trump and Hillary Clinton.
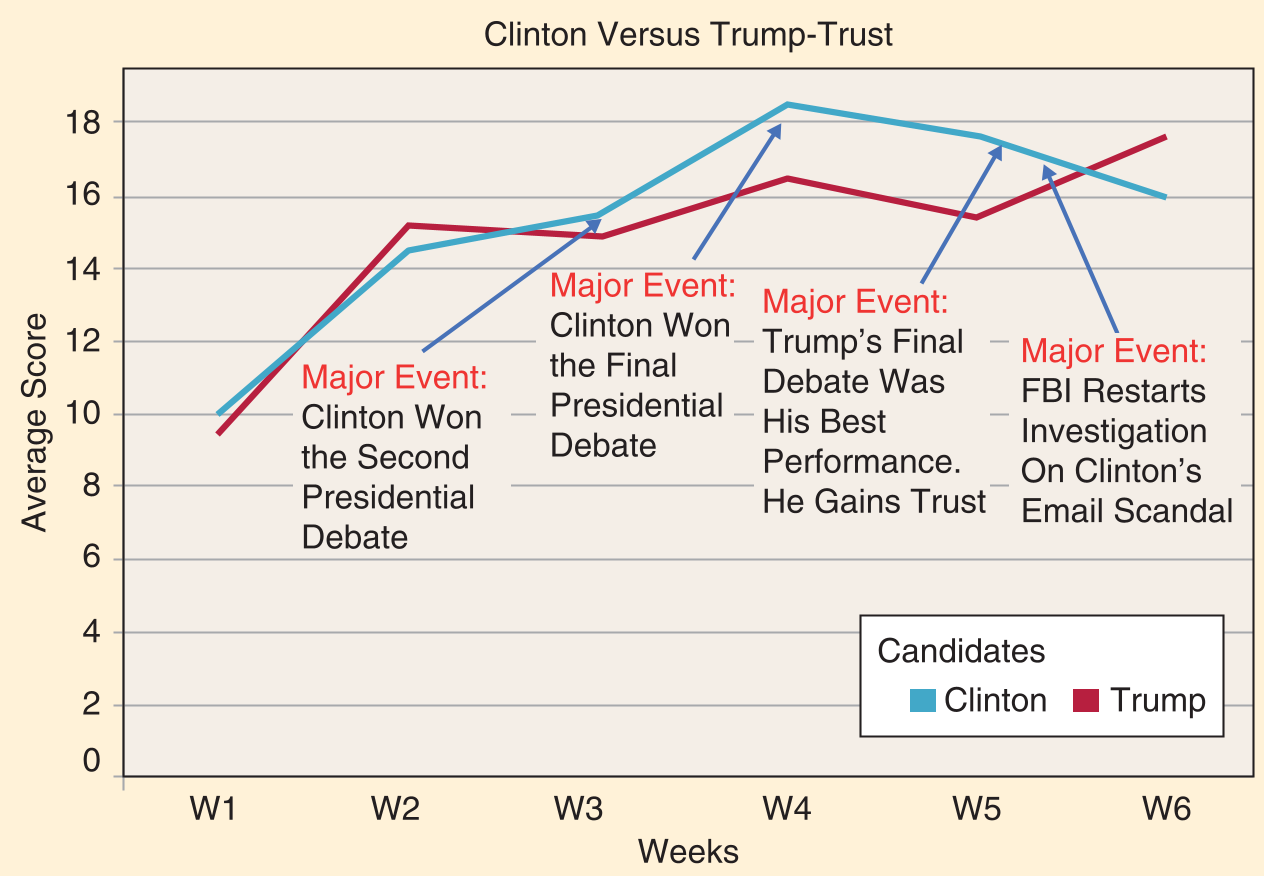 Figure 1: The "Trust" and "Disgust" trajectories for both candidates over the six weeks leading to the election.
A Dynamic Emotional Rollercoaster
The study's most compelling finding was how well the emotion data "echoed" real-world events:
- The Trust Gap: Both candidates experienced a roller coaster of trust. However, after the final debate and the reopening of the FBI email investigation, Clinton’s "Trust" and "Joy" metrics plummeted.
- The Disgust Peak: Public disgust toward Donald Trump peaked in the third week of the study, precisely when the "Access Hollywood" tape was released.
- The Reversal: Despite high disgust scores initially, Trump gained significant "Trust" and "Joy" scores in the final week relative to Clinton, providing an early indicator of the eventual result.
Experimental Results: Beating the Pollsters
The NRC classifier's 89.5% accuracy rate is particularly impressive when compared to mainstream pollsters. While organizations like CNN or NYT predicted a Democrat win in states like Michigan, Pennsylvania, and Florida, the Twitter emotion data correctly identified the Republican lean.
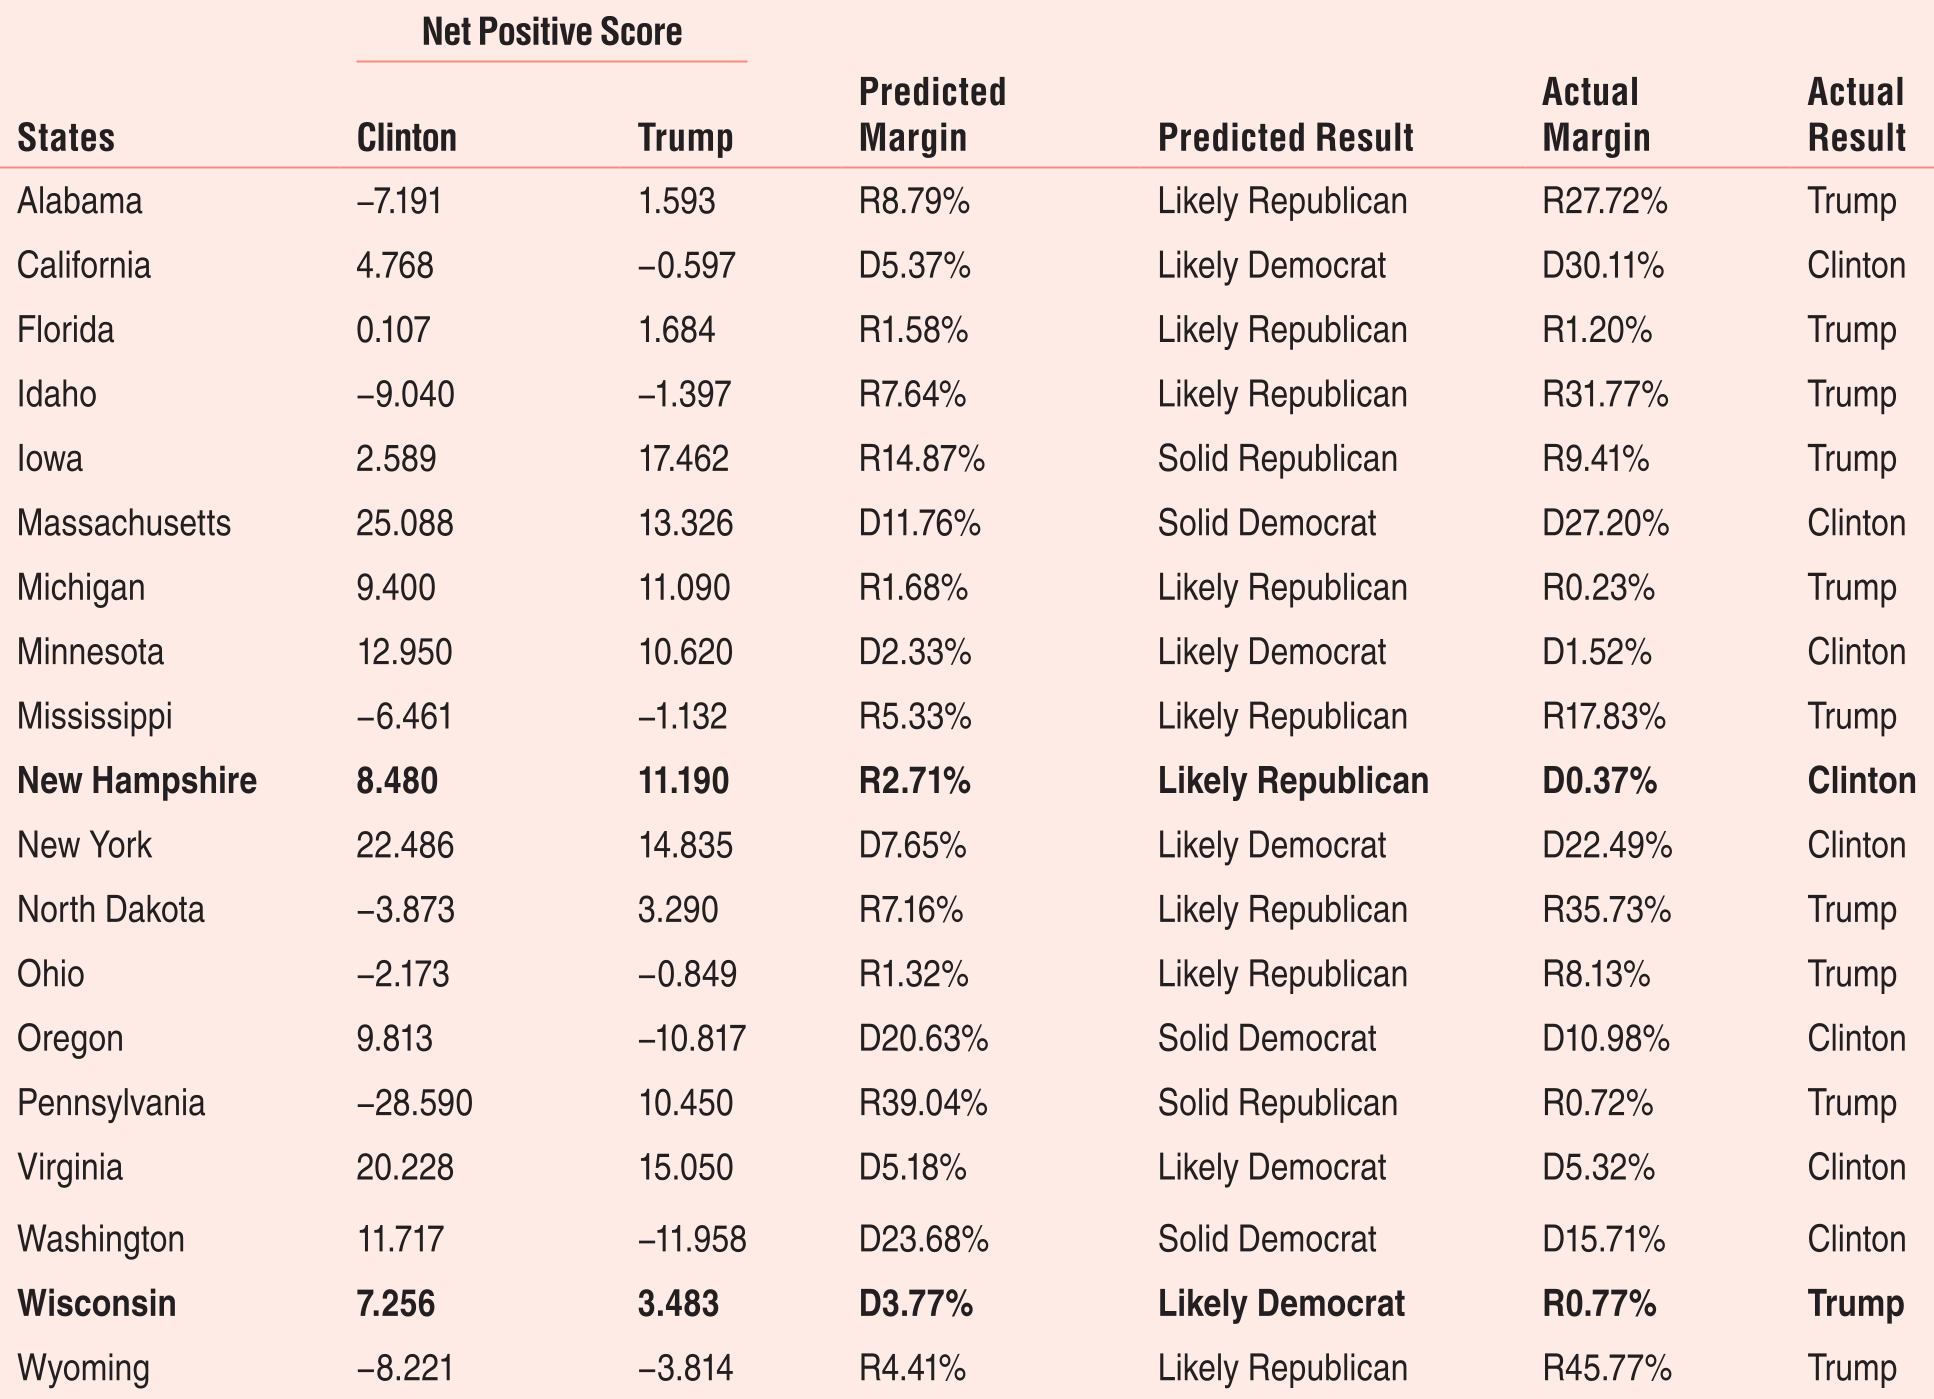 Table 1: The comparison between predicted margins and actual election outcomes across 19 states.
The only two misses were Wisconsin and New Hampshire—both states where the actual margin of victory was less than 1%, sitting well within the statistical margin of error for any predictive model.
Critical Insight & Conclusion
This research proves that Emotion Classification is a much more powerful lens than simple Sentiment Analysis. While sentiment tells us "what" people like, emotion tells us "why" they are switching allegiances.
Takeaways:
- Real-time Sensitivity: Lexicon-based emotion tracking can detect the impact of a news cycle (like a debate or a scandal) within hours, whereas traditional polls take days to field.
- Granularity Matters: The ability to distinguish between "Anger" (which might drive a voter to the polls) and "Sadness" (which might result in voter apathy) is crucial for political modeling.
Limitations:
The authors acknowledge that despite the high accuracy, Twitter users are not a perfectly representative sample of the general voting population. Future work could benefit from integrating demographic weighting to further refine the predictive power of social media mining.