
Twitter Food Mining: Turning Social Media into a Global Dietary Sensor
Twitter Food Photo Mining and Analysis for One Hundred Kinds of Foods
The paper presents a large-scale system for mining and analyzing food photos from the Twitter stream using a 100-class classifier (UEC-FOOD100). By combining keyword-based filtering with state-of-the-art visual recognition, the authors detected approximately 470,000 food photos over a 28-month period, achieving nearly 99% precision for many categories.
TL;DR
Researchers from the University of Electro-Communications have developed a high-speed pipeline to mine and analyze food photos from Twitter. By processing over 122 million Japanese tweets, they extracted 470,000 verified food images using a specialized "Foodness" classifier and a 100-category recognizer. The result is a massive real-time map of what, when, and where Japan is eating.
Context & Motivation
Twitter is a unique microblogging platform characterized by its "on-the-spot-ness." Unlike static datasets, it provides a real-time stream of human behavior. However, mining specific types of content—like food—is notoriously difficult. Previous attempts to classify "visual tweets" (where text matches the image) suffered from low precision (~70%) because they used generic models.
The authors argue that to achieve high-precision mining, one needs a specialized hierarchical approach that confirms not just that an image contains "something," but specifically "food," and then matches it to the user's text.
Methodology: The Three-Step Sieve
The authors propose a logic that moves from broad text to specific visual verification:
- Keyword Filtering: Monitoring the Twitter Streaming API for 100 specific Japanese food names (e.g., Ramen, Sushi, Curry).
- "Foodness" Classifier (FC): A critical intermediate step. Before checking if a photo is "Ramen," the system checks if it is even "Food." They grouped 100 food categories into 13 superordinate groups (like "noodles" or "deep fried") using a confusion-matrix-based clustering to build a robust "is-this-food" filter.
- Individual Food Classifiers (IFC): Using Improved Fisher Vector (IFV) encoding with HOG and Color patches. This allows for extremely fast processing (0.024s per image), which is essential for the high-volume Twitter stream.
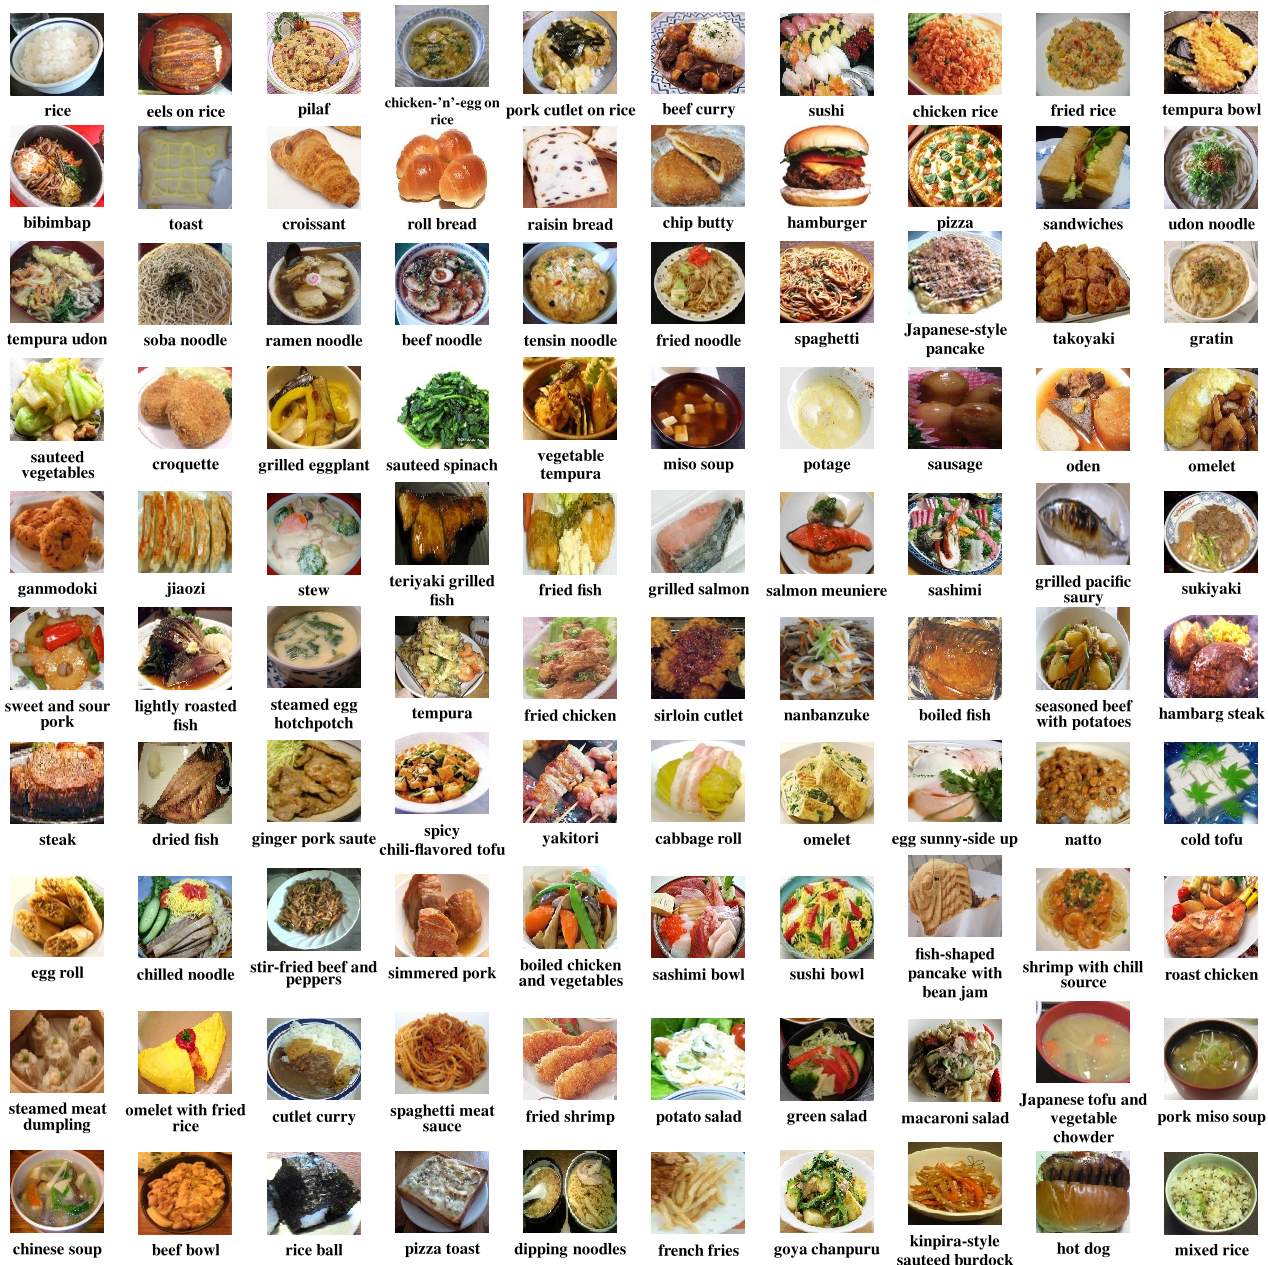 Figure 1: Sample images from the UEC-FOOD100 dataset used to train the classifiers.
Insights from 470,000 Meals
The experimental results over a two-year period reveal fascinating cultural patterns:
- The Big Two: Ramen and Curry dominate Japanese Twitter, reflecting their status as national favorites.
- Commercial vs. Homemade: The researchers noted that while "Ramen" photos are usually taken in restaurants, "Omelet" (Ome-rice) photos often show ketchup drawings, suggesting they are mostly cooked at home.
- Precision Boost: The combination of text + Foodness + Individual classification achieved a precision of 99.7% for Ramen, whereas text alone was only 72% accurate.
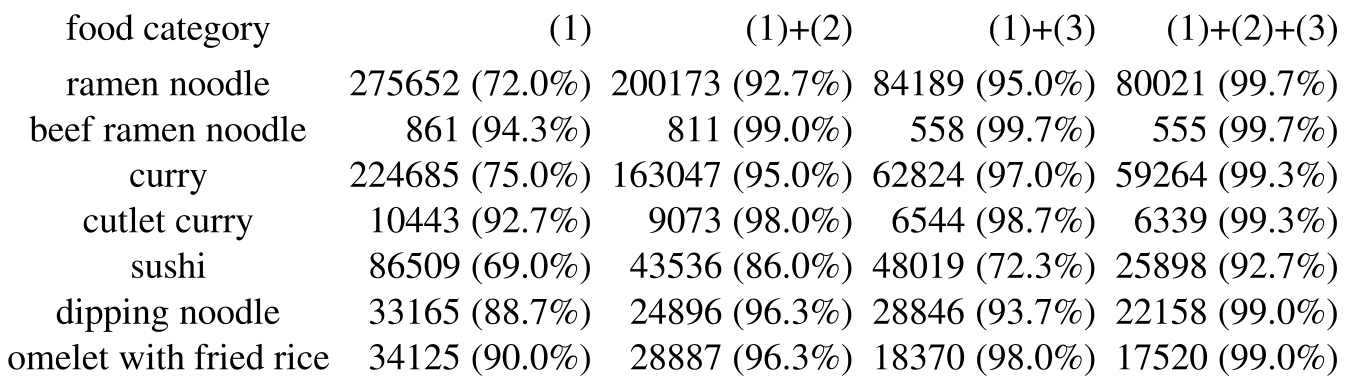 Table 1: The synergy of Text (1) + Foodness (2) + Visual Classifier (3) dramatically reduces noise.
Spatio-Temporal Analysis
By mapping geotagged tweets, the authors created a "Prevailing Food Map." They discovered that "Curry" popularity spikes in the summer, while "Ramen" peaks in the winter. Regional specialties also emerged: Hiroshima consistently showed a high density of "Okonomiyaki" photos regardless of the season.
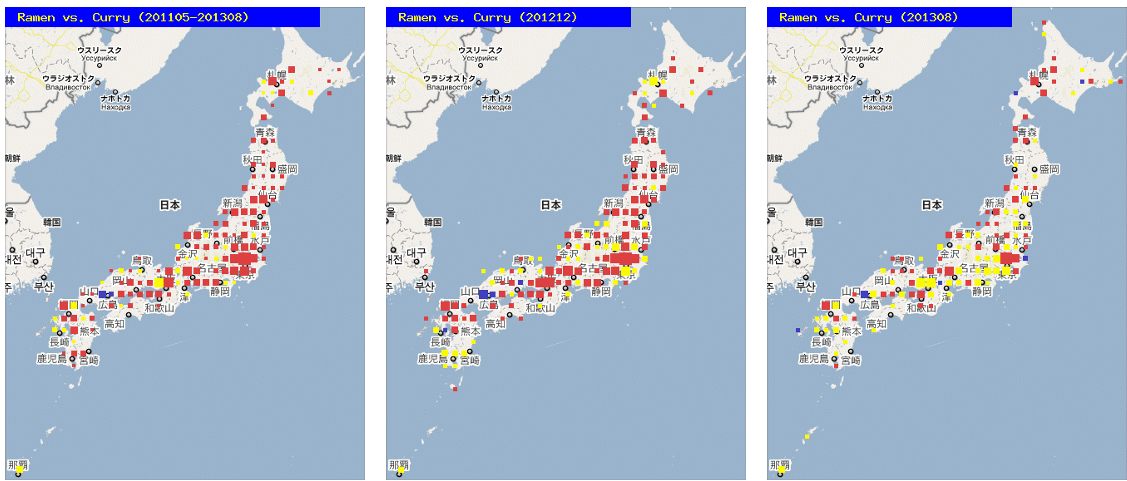 Figure 2: Seasonal shifts in food preference across Japan (Left: Average, Center: Winter, Right: Summer).
Conclusion & Future Impact
This work demonstrates that with the right "visual verification" pipeline, social media can be transformed into a valuable tool for public health and marketing research. The authors' ability to process images in real-time (10 images per minute on a single machine) sets a benchmark for "social sensor" applications.
The next frontier? The authors plan to release a dataset of over one million labeled food photos, which will undoubtedly accelerate the development of fine-grained food recognition models.