
Twitter as a Distributed Camera: Mining Real-World Events via Geo-Tweet Photos
[Demo paper] twitter visual event mining system
The paper introduces a Twitter Visual Event Mining System that automatically extracts and visualizes real-world events by analyzing "geo-tweet photos." By combining spatio-temporal keyword bursting with visual clustering (SURF + Color Histograms), the system achieves a precision of 65.5% in identifying representative event photos from millions of tweets.
TL;DR
This paper presents a pioneering system that treats Twitter users as a global network of "distributed image sensors." By analyzing geo-tweet photos—tweets containing both location data and images—the system automatically detects, clusters, and maps real-world events like festivals and natural phenomena with 65.5% precision.
Context: Why Twitter Beats Flickr for Event Mining
Historically, researchers turned to Flickr for geotagged photos. However, the authors argue that Flickr is "travel-oriented," while Twitter is "quick and on-the-spot." Twitter captures the pulse of everyday life (food, weather, emergencies) in real-time. The challenge lies in the noise: how do you filter millions of random photos to find the few that define a specific event?
Methodology: From Textual Bursts to Visual Coherence
The system operates through a logical funnel designed to reduce noise at every step:
- Spatio-Temporal Detection: The system monitors 1-degree latitude/longitude grids. If a keyword's frequency spikes (bursts) in a specific area on a specific day, it's flagged as an event candidate.
- Visual Clustering: Instead of trusting text alone, the system extracts Bag-of-Features (BoF) using SURF descriptors and color histograms. It uses the Ward method (hierarchical clustering) to group images that look similar.
- Scoring & Selection: Not all clusters are relevant. The system calculates "inner similarity." A high visual coherence score (typically > 5.0) indicates a successful event detection.
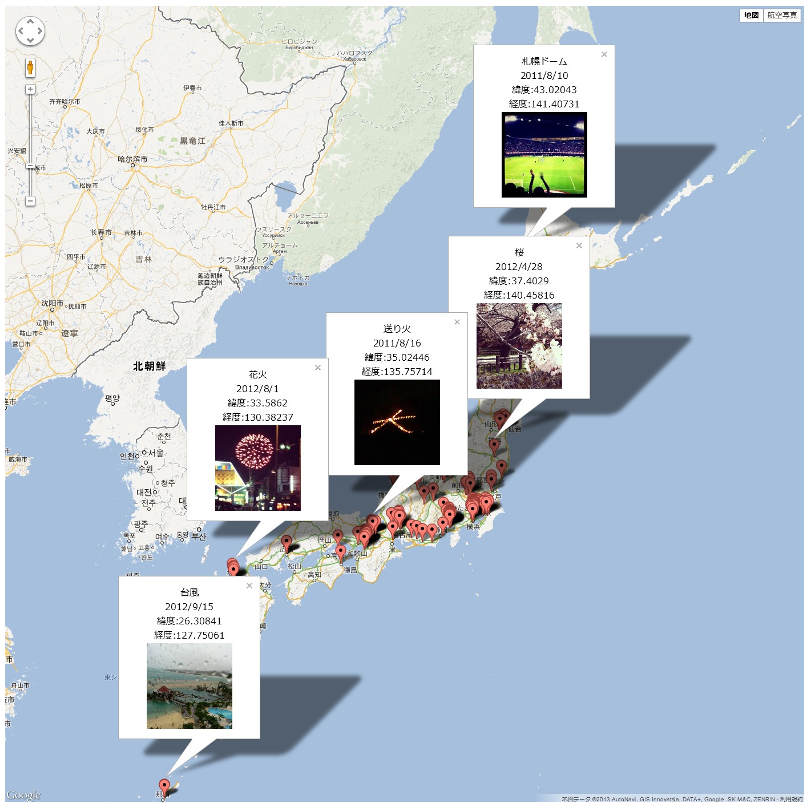 Figure 1: The system visualizes events on an interactive map, linking keywords to representative photos based on visual density.
Experimental Insights: Separating Signal from Noise
The authors processed 3,000,000 photos over 1.5 years. The system's ability to differentiate between similar keywords but different visual contexts is impressive.
For example, in the "Firefly" experiment (Figure 3 below), the system correctly identified that photos surrounding the keyword on a specific date in Tokyo weren't actually insects, but the "Tokyo Firefly" illumination event at the Skytree.
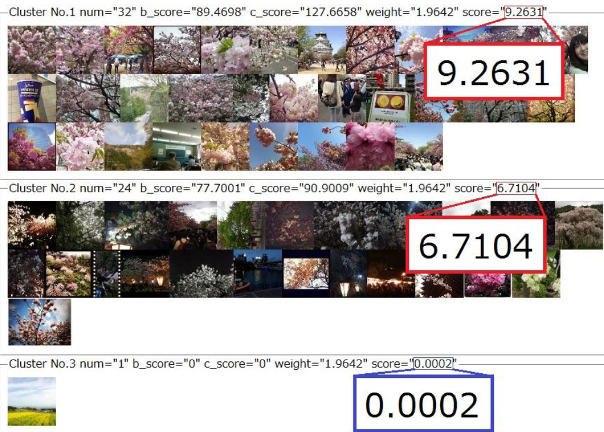 Figure 2: Clustering results for "Cherry Blossoms." The red boxes denote highly coherent event clusters (daytime vs. nighttime blooms).
Critical Analysis & Future Outlook
While the 65.5% precision was a significant "SOTA" for its time (2013), several limitations exist:
- Manual Thresholds: The reliance on a fixed cluster score (5.0) may not scale across different types of events (e.g., a "rainbow" has much higher visual similarity than a "political protest").
- Feature Evolution: Modern implementations would likely replace SURF with Self-Supervised Vision Transformers (ViT) to better capture semantic meaning rather than just low-level textures.
Conclusion: This work laid the groundwork for modern social sensing. It moved the needle from "what are people saying?" to "what are people seeing?", providing a blueprint for turning chaotic social streams into structured geographical knowledge.