
Beyond Global Popularity: Decoding the Two-Dimensional Centrality of Social Networks
Two-Dimensional Centrality of a Social Network
The paper proposes a multi-dimensional approach to social network centrality by utilizing both the largest and second-largest eigenvectors of a friendship relationship matrix. This "Two-Dimensional Centrality" framework reveals not only global popularity (Dimension 1) but also local subgroup structures and affiliations (Dimension 2) within a network.
TL;DR
While most network analysis focuses on a single "centrality" score to identify the most powerful actors, this paper by Akinori Okada argues that social importance is multi-faceted. By extracting the second eigenvector of a relationship matrix, researchers can simultaneously identify global leaders and the hidden subgroups that define the network's local architecture.
The Limitation of One-Dimensional Power
In social network analysis (SNA), "centrality" is often treated as a linear ranking. If you are friends with many powerful people, you are powerful—this is the core intuition of Eigenvector Centrality. However, this summarizes an entire social system into a single number, effectively ignoring the cliques and factions that often drive social dynamics. A "big fish in a small pond" might be missed by global metrics, yet they are crucial for understanding local influence.
Methodology: The Power of the Second Eigenvector
The author moves beyond the standard Bonacich (1972) approach. Instead of just looking at the primary eigenvalue (), the procedure examines the structural information hidden in the second eigenvalue () and its corresponding vector.
1. Dimension 1: Global Centrality
The first eigenvector consists of non-negative elements. It represents the "Global Popularity" or the general strength of an actor's presence in the network.
2. Dimension 2: Local Centrality and Subgroups
The second eigenvector contains both positive and negative values. This is the "Aha!" moment of the paper:
- The Sign (+/-): Acts as a classifier. Actors with the same sign belong to the same subgroup.
- The Absolute Value: Represents the "Local Centrality"—how significant an actor is within their specific subgroup.
- The Product: If two actors have a negative product (one + and one -), it suggests a "negative" or weak relationship between different factions.
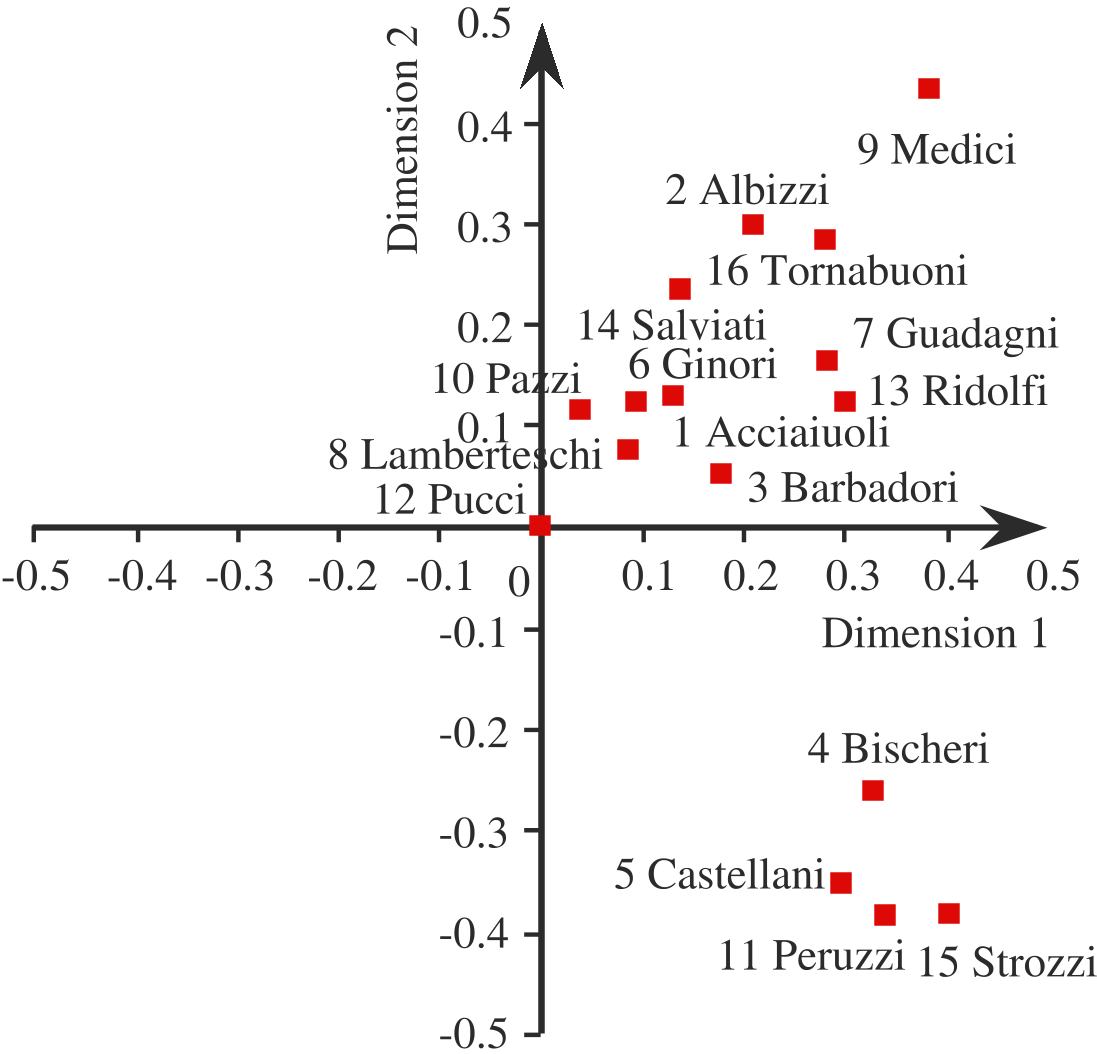 The figure above illustrates the 16 actors plotted on a 2D plane. Dimension 1 (X-axis) shows global importance, while Dimension 2 (Y-axis) clearly separates the secondary subgroup from the main cluster.
Experimental Validation: The Florentine Families
The author tested this on the classic dataset of marital ties between 16 Florentine families.
| Actor (Family) | Dim 1 (Global) | Dim 2 (Local) |
|---|---|---|
| Medici (9) | 0.383 (High) | 0.434 (Subgroup A) |
| Strozzi (15) | 0.404 (High) | -0.382 (Subgroup B) |
| Pucci (12) | 0.000 (Low) | 0.000 (Isolated) |
Key Findings:
- Statistical Correlation: Dimension 1 correlates at 0.90 with the number of total ties. Dimension 2 correlates at 0.85 with intra-subgroup ties.
- Structural Alignment: The results almost perfectly mirror the ADCLUS (Additive Clustering) model, but without the heavy computational overhead of iterative clustering algorithms.
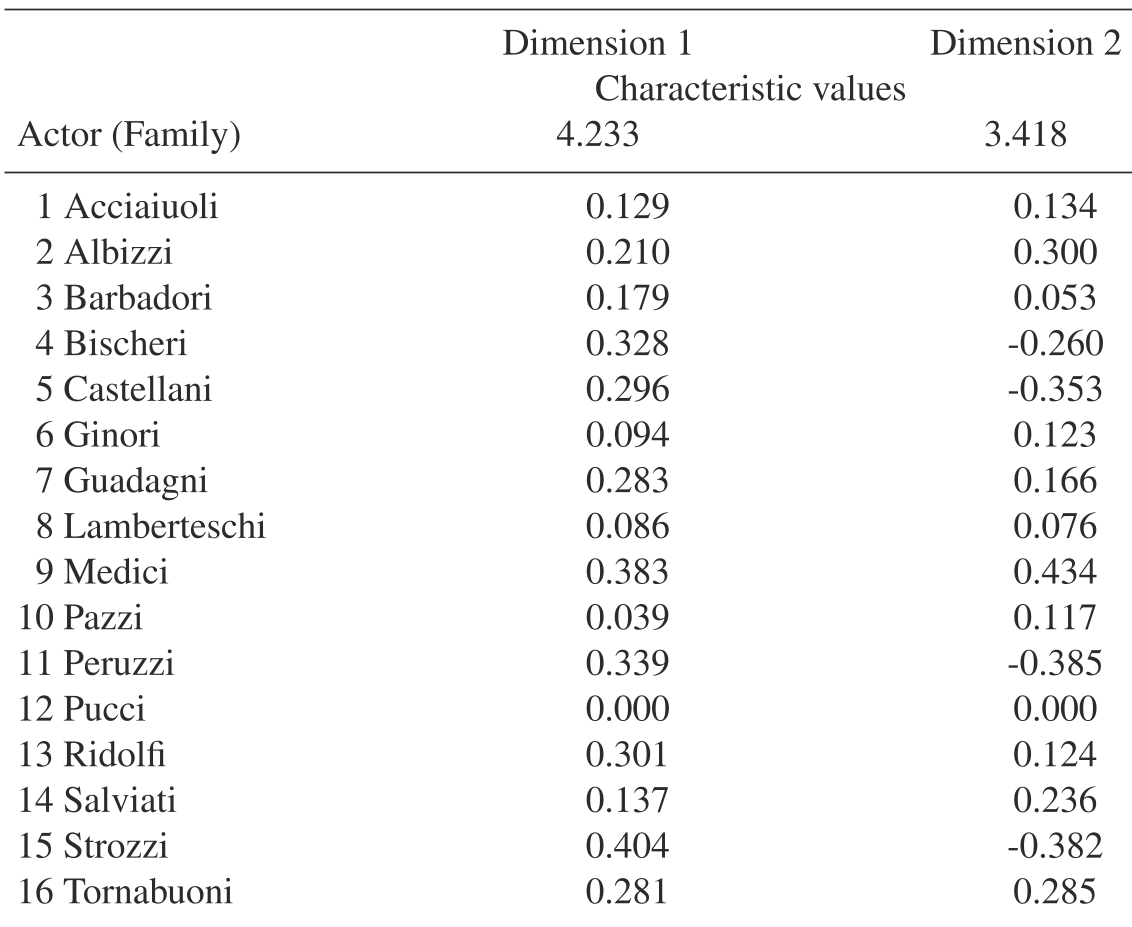 The numerical results demonstrate how Family 15 (Strozzi) and Family 9 (Medici) both hold high global power, but belong to opposing structural poles on Dimension 2.
Critical Insight: Why This Matters
The genius of this approach lies in its mathematical simplicity. It reveals that Spectral Clustering and Centrality Analysis are essentially two sides of the same coin.
However, the study has limitations:
- Symmetry Assumption: The current model assumes relationships are reciprocal (), which isn't always true in social media (e.g., following vs. being followed).
- Binary Data: The model uses 1/0 ties. Future work should explore weighted relationships to see if the "local centrality" resolution improves.
Conclusion
Okada’s "Two-Dimensional Centrality" teaches us that being at the center of the world is not the same as being at the center of your community. By looking at the second dimension, researchers can map the "us vs. them" landscape of any social network, providing a richer, more nuanced view of social power.