
Beyond Call Logs: How Mobile Money Transactions Predict Urban Poverty
The Unbanked and Poverty: Predicting area-level socio-economic vulnerability from M-Money transactions
This paper introduces a novel framework for predicting area-level socio-economic vulnerability in emerging economies using Mobile Money (M-Money) transaction records. By analyzing 7.6 million M-Money and 450.2 million Call Detail Records (CDR) from Dar es Salaam, Tanzania, the authors achieved a socio-demographic classification accuracy of 71.3% (F1: 0.70), significantly outperforming traditional CDR-based models.
TL;DR
Researchers at the University of Nottingham have demonstrated that Mobile Money (M-Money) data is a far more powerful predictor of poverty than traditional Call Detail Records (CDR). By analyzing financial transactions in Dar es Salaam, Tanzania, they achieved a significant jump in socio-economic classification accuracy (F1 score from 0.63 to 0.70), proving that how people move money says more about their vulnerability than how they use their phones.
The "Data Tragedy" in Emerging Economies
In many emerging markets, official census data is a "luxury" that is often coarse, expensive, and out-of-date. While researchers previously turned to CDR—logs of calls and SMS—to fill this gap, these proxies have hit a ceiling. Call patterns can be noisy, and as mobile usage becomes ubiquitous, the signal identifying the "middle class" versus the "poor" begins to blur.
The authors argue that we are ignoring a goldmine: M-Money. In Tanzania, over 50% of users use mobile financial services, while only 2% have active bank accounts. This makes M-Money the primary heartbeat of the local economy.
Methodology: Financial Behavior as a Proxy
The study compared three models: one based on CDR, one on M-Money, and a Combined model. They mapped these data points to a custom, high-resolution ground-reference survey of 517 regions in Dar es Salaam.
Key Metrics Engineered:
- CDR Features: Interaction frequency, entropy of contacts, and spatial diversity (how many towers you visit).
- M-Money Features: Average monthly "In/Out" amounts, "Spending Uptake," and behavioral indicators like "Balance Checks" and "Defaulted Transactions" (failed due to insufficient funds).
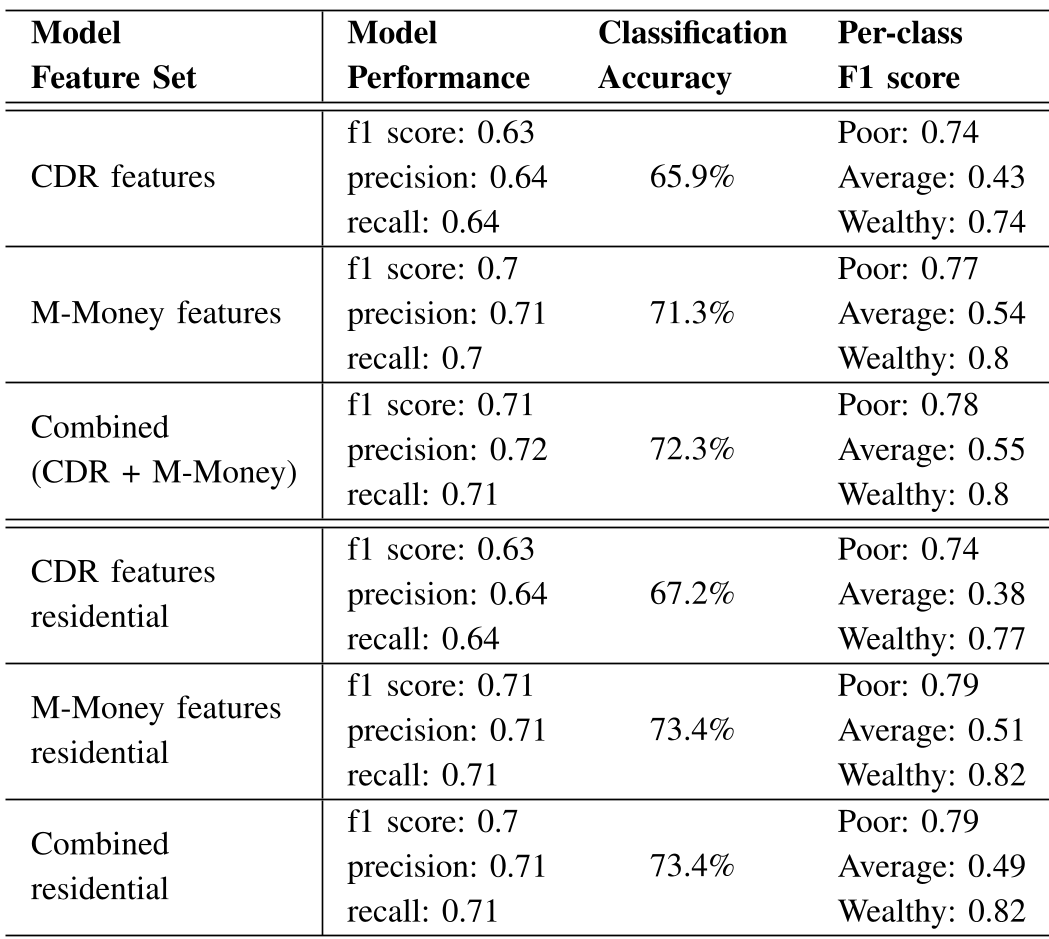 Table showing that M-Money features consistently outperform CDR across all socio-economic classes.
Why M-Money Wins: Intuition and Insight
The paper's most fascinating contribution is the Variable Importance analysis. They found that six of the seven most predictive features were M-Money derived.
1. The Survival Mechanism: Balance Checks
One standout feature is the frequency of balance checks. The model found that as balance checks increase, the likelihood of an area being "poor" rises. Physical Intuition: Those living close to the breadline must manage their liquidity with extreme precision, checking their accounts far more frequently than the wealthy.
2. The Unbanked Paradox: User Uptake
Counterintuitively, a high uptake of M-Money was often negatively correlated with extreme wealth in certain contexts. Because the wealthy have access to traditional "brick and mortar" banks, M-Money serves as the primary gateway for the unbanked, making it a high-signal indicator for those currently excluded from formal financial systems.
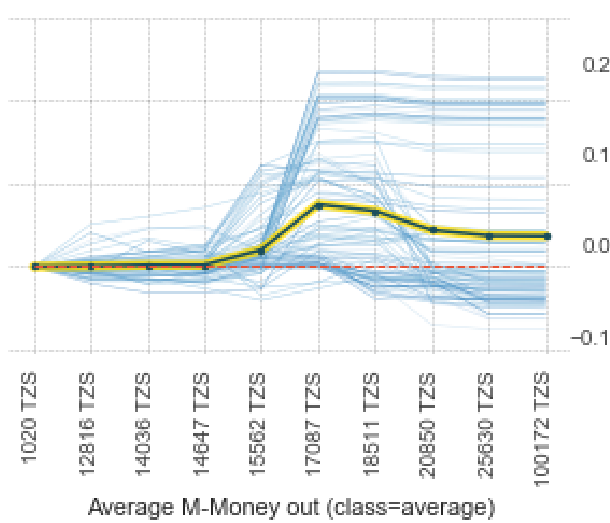 Partial Dependence Plots showing how "Average M-Money In" acts as a binary classifier between poor and wealthy areas.
Real-World Impact and SOTA Results
The classification results were striking:
- Accuracy Baseline (CDR): 65.9%
- M-Money Accuracy: 71.3%
- Combined: 72.3%
The fact that the combined model barely improved upon the M-Money model suggests informational subsumption. M-Money essentially "contains" the predictive power of CDR data and adds a layer of financial nuance that calls simply cannot capture.
Critical Analysis & Future Outlook
While the results are a major win for data-driven policy, the authors admit to several limitations:
- Selection Bias: The study is limited to those who use these services; however, with 92% mobile penetration in Tanzanian cities, this is becoming less of a concern.
- Urban Complexity: In dense cities like Dar es Salaam, "slums" and "wealthy corridors" often exist within the same 500 meters, making tower-level (BTS) aggregation tricky.
Conclusion: This research proves that in the quest to map poverty, we should follow the money, not just the talk. For NGOs and governments, M-Money transaction logs represent a real-time, scalable infrastructure for identifying vulnerability in the world's fastest-growing urban areas.