
London's Digital Pulse: Deciphering Urban Happiness through Twitter and Geography
Understanding happiness in cities using Twitter: Jobs, children, and transport
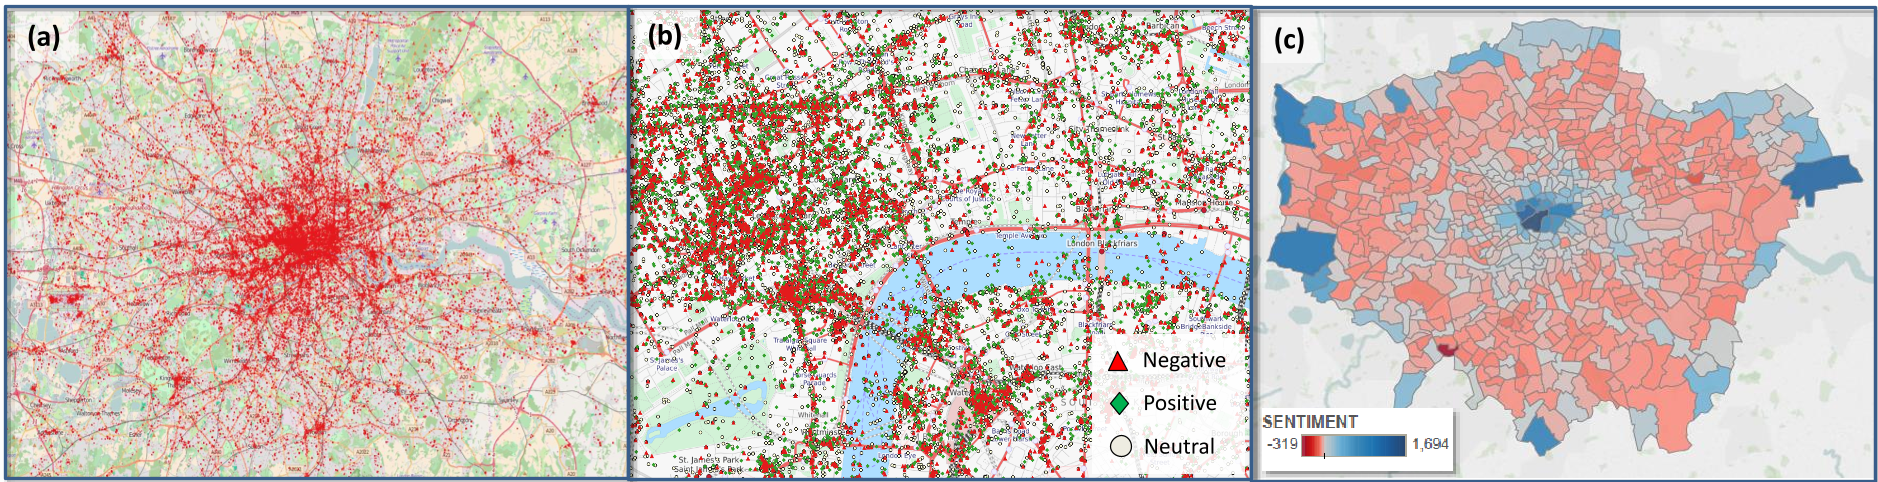
This study utilizes NLP techniques to analyze 0.4 million geo-tagged Tweets in Greater London, mapping large-scale sentiment data to urban geography. The researchers identified that daily urban facets (jobs, children, and transport) explain up to 47% of variance in citizen happiness, outperforming traditional long-term socioeconomic indicators.
TL;DR
By analyzing 400,000 geo-tagged tweets in London, researchers have moved beyond simple "mood maps" to find the structural drivers of happiness. The study reveals that job proximity is the strongest predictor of positive sentiment, while child density and transit middle-ground (neither excellent nor car-dependent) correlate with lower happiness levels.
Background: Beyond the Survey
Measuring how a city "feels" has traditionally been the domain of expensive, infrequent census surveys. While these capture long-term stats like income and education, they miss the pulse of daily urban life. This paper positions itself as a bridge between Large-Scale Sentiment Data and Urban Socioeconomics, asking why some neighborhoods are inherently "happier" than others.
The "Lived Experience" Factor
The researchers' most striking insight is that the parameters affecting us daily—where we work, how we commute, and our immediate household composition—influence our expressed happiness far more than "ambient" factors like local crime rates or education quality.
Methodology: Mapping Emotions at Scale
The study uses a keyword-based NLP approach to filter and score tweets across London’s 628 wards. By aggregating individual sentiments into neighborhood averages, they could correlate digital emotions with physical infrastructure.
Core Findings: The Three Pillars of Urban Sentiment
1. The Job Magnet (+ Efficiency)
The number of jobs available in a ward explains nearly 47% of sentiment variance. Interestingly, it is the existence of businesses and opportunities in proximity, rather than just the employment status of individuals, that promotes a positive atmosphere.
2. The Parenting Paradox
The study found a consistent negative correlation (R² = 0.33) between the percentage of children in a ward and the happiness scores of tweets. While the authors suggest cultural context plays a role, the data indicates a steep decline in sentiment as child density increases from 5% to 15%.
3. The Transport "U-Curve"
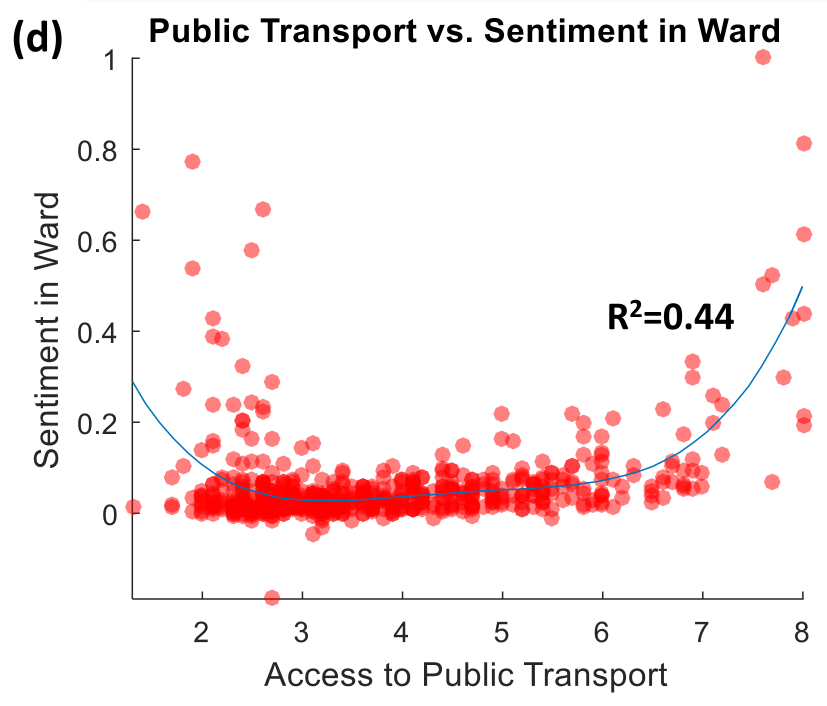
One of the most counter-intuitive findings is the parabolic relationship between transport and happiness.
- High Access: People near major hubs are happy due to convenience.
- Low Access: People in remote wards are also happy, likely because they have adapted with private vehicles (owning 4x more than city-center dwellers).
- The "Middle-Deep": Those with mediocre access—too far to walk, too close to justify a car—express the highest levels of frustration.
Deep Insight: Why This Matters for Smart Cities
For urban planners, this paper is a call to move beyond Cost-Benefit Analysis. If transport "purgatory" (mediocre access) is a primary source of resident dissatisfaction, simply adding a few more bus stops might not be as effective as creating "extreme" accessibility or supporting localized remote work hubs.
Critical Analysis & Limitations
While the study is a breakthrough in mapping, it acknowledges the Twitter Bias: the data represents social media users (approx. 25% of the UK adult population) rather than a perfect demographic slice. Furthermore, the unigram method—while scalable—can struggle with sarcasm or complex linguistic nuances.
Conclusion
This research proves that our digital footprints are a viable mirror for urban health. By focusing on the daily friction points of jobs and mobility, cities can be designed not just for economic output, but for the actual happiness of their inhabitants.