
Quantifying the Intangible: A Graph-Based Model for Social Capital in Collaborative Networks
Understanding Social Capital in Collaborative Networks
2010-01-01
Summary
Problem
Method
Results
Takeaways
Abstract
This paper proposes a mathematical framework and graphical model for assessing Social Capital within Virtual organization Breeding Environments (VBEs). By integrating Social Network Analysis (SNA) with asset mapping, the authors introduce metrics such as "Level of Health" (LH) and "Effective Social Capital" (ESC) to quantify the intangible value members derive from collaborative networks.
## TL;DR
While physical assets (cash, goods) are easy to count, the "hidden" value of being in a professional network—**Social Capital**—is notoriously hard to measure. This paper introduces a formal mathematical and graphical model to quantify social capital within Virtual Breeding Environments (VBE). By combining relationship health with asset accessibility, it allows companies to calculate exactly how much "capital" they can leverage to survive market turbulence.
## The Motivation: Moving Beyond "Intuition"
In the world of Collaborative Networks (CNs), we intuitively know that "who you know" matters as much as "what you have." However, because social capital is embedded in relationships rather than being owned by a single entity, it is often ignored in formal business strategies.
The authors identify a critical gap: **the lack of objective measurement**. Without a way to put a number on social capital, managers cannot optimize their networks, and companies cannot prove the value of their membership in professional ecosystems.
## Methodology: Mapping Connectivity and Utility
The core contribution of this work is the **Aggregate Map**. This isn't just a simple network diagram; it is a fusion of two distinct types of data:
1. **Map of Business Contacts**: A weighted graph where nodes are enterprises and links represent the "Level of Health" (LH) of the relationship.
2. **Map of Enterprises' Assets**: A bipartite graph linking organizations to the tangible/intangible assets (knowledge, market access, resources) they possess.
### The "Level of Health" (LH) Formula
The authors quantify relationship quality using a weighted linear combination that accounts for both hierarchical (subordinate) and horizontal (peer) interactions:

* **SRFC/SRIC**: Subordinate relationship frequency and intensity.
* **PRFC/PRIC**: Peer relationship frequency and intensity.
* **VS**: Value System alignment (trust, norms).
### Calculating Social Capital
The model defines three levels of social capital:
* **Partial Social Capital (PSC)**: The utility accessed through a specific perspective (e.g., Innovation or Market).
* **Effective Social Capital (ESC)**: The capital actually used for a specific business activity.
* **Total Social Capital (TSC)**: The theoretical maximum an organization could extract if all network ties were fully leveraged.
## Experimental Insight: The E4 Scenario
The authors applied their model to a simulation of seven organizations (E1–E7). By mapping different perspectives—**Innovation, Market, and Capacity**—they demonstrated how the same network structure provides different values depending on the goal.
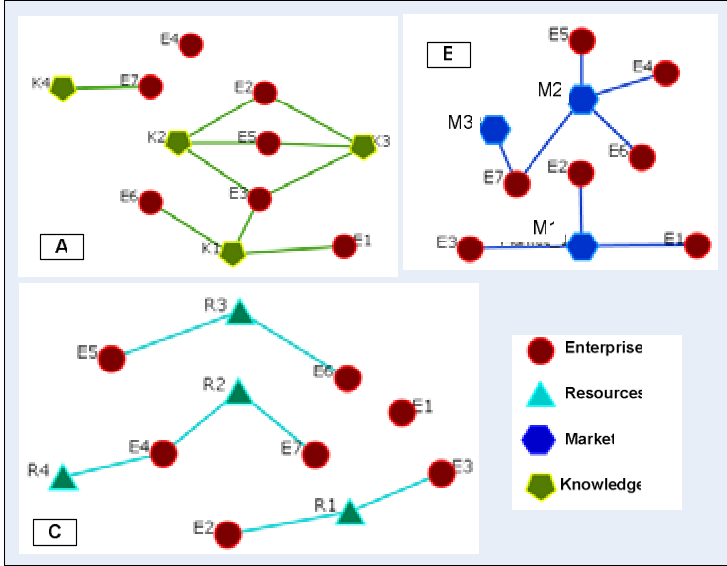
**Key Finding**: In the case of enterprise E4, the study found that its **Total Social Capital (19 units)** was significantly higher than its **Effective Social Capital (9 units)** for a specific opportunity. This quantitative gap provides a clear "call to action" for managers: the organization is underutilizing its available network resources.
## Critical Analysis & Takeaways
The strength of this paper lies in its **structural approach**. By adapting Social Network Analysis (SNA) concepts like "Nodal Degree" and "Closeness Centrality" into a business utility context, it moves social capital from a fuzzy sociological concept to a concrete management KPI.
### Limitations
* **Data Intrusiveness**: As the authors admit, collecting data on "contact frequency" and "trust" without being intrusive is difficult.
* **Static Nature**: The model acts as a snapshot. Future work needs to address how social capital fluctuates over time (e.g., after a collaborative project fails).
### Final Thoughts
This research reminds us that in modern collaborative ecosystems, an enterprise's "survival capability" isn't just about its bank balance—it's about the health of its ties and the utility of the assets it can reach through those ties. For VBE managers, this model provides the first step toward a "Social Capital Dashboard" for the 21st-century network.