
Deciphering the Rhythm of Streams: A Deep Dive into Spotify User Behavior
Understanding user behavior in Spotify
This paper presents a comprehensive empirical study of user behavior on Spotify, a major peer-assisted music streaming service. By analyzing massive datasets from 2010-2011 across multiple countries, the authors characterize system dynamics and individual usage patterns, establishing foundational insights into how music consumption differs from video streaming.
TL;DR
This seminal study analyzes one of the first massive datasets from Spotify (2010-2011) to understand how we consume music. It reveals that music streaming is fundamentally different from video: it is a "background" medium with distinct morning peaks, high session "inertia" on mobile devices, and predictable correlations between how long we listen and when we return.
Context: Why Music is Not Video
In the early 2010s, most network research focused on Video-on-Demand (VoD). However, this paper argues that music is a different beast. Unlike a movie, which demands visual and auditory focus, music often fills the gaps of our lives—commuting, working, or relaxing. This "lower attention" requirement leads to unique system workloads and user churn patterns that the authors set out to quantify.
System Dynamics: The Pulse of the Service
The authors found that Spotify usage isn't random; it follows a strict daily orchestration.
1. The Arrival Pattern
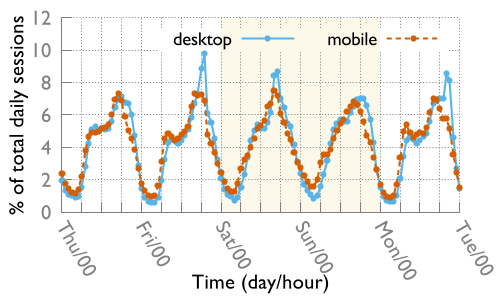
The researchers modeled session arrivals as a non-homogeneous Poisson process. By breaking time into 10-minute windows, they proved that arrivals within those windows are independent and exponentially distributed, though the overall rate () fluctuates wildly throughout the day.
- Desktop: Features a sharp "morning peak" (9-10 AM) as users start their workdays.
- Mobile: Peaks occur earlier, likely tied to commuting hours.
2. Session Length & Playbacks
A fascinating insight is the "Background Music Effect." On desktops, the longest sessions occur in the morning. Interestingly, these morning sessions also generate a disproportionately high number of playbacks (e.g., a peak representing 4.5% of sessions generated 8% of playbacks), suggesting highly active listening or automated playlist consumption during work hours.
User Behavior: The Multi-Device Switch
Perhaps the most novel part of this study is the analysis of Device Switching. As smartphones became ubiquitous, the researchers tracked how users moved between their PCs and phones.
The Law of Inertia
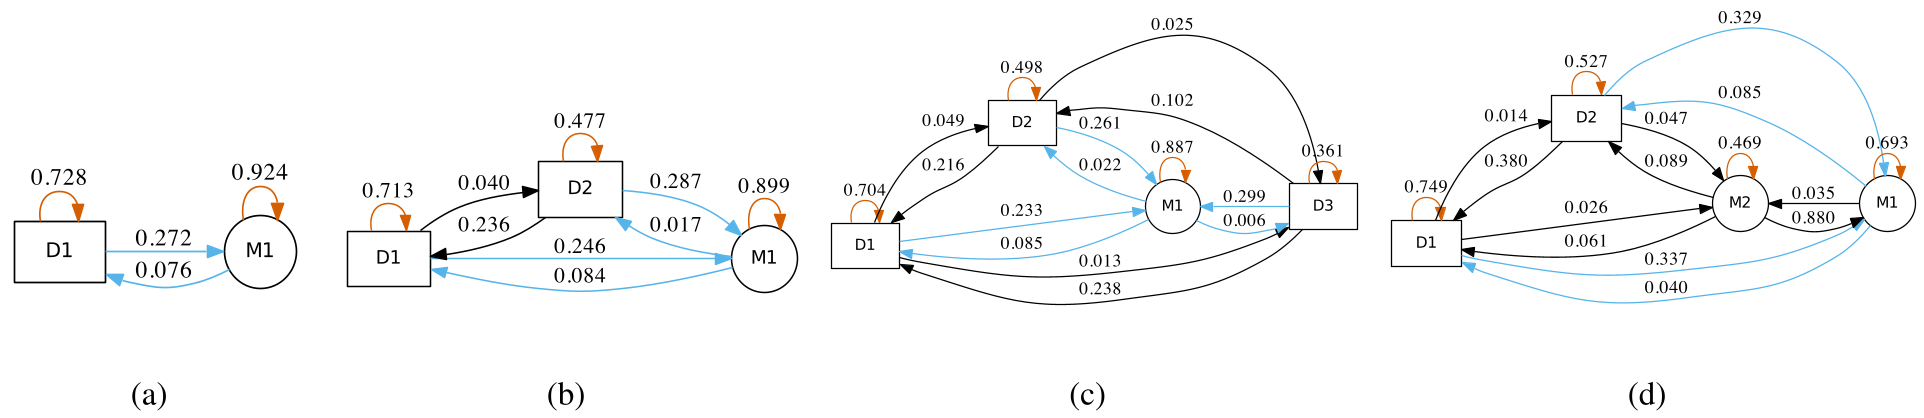
Users exhibit a strong "inertia"—a tendency to stay on the device they are currently using.
- Mobile Inertia: The probability of staying on a mobile device for the next session is recorded as high as 0.789.
- The Desktop-to-Mobile Hop: There is a consistent 22.6% - 29.9% probability that a user will switch from their desktop to their primary mobile device, likely reflecting the transition from office work to commuting.
Predictability of Churn
Can we predict when a user will come back? The paper suggests we can. By analyzing session pairs, the authors found:
- Linear Correlation of Length: The length of your current session is a strong indicator of the next session's length.
- The "Quick Return" Phenomenon: For short sessions (under 15 minutes), there is a linear correlation with downtime. If a user pops in for a quick song, they are statistically likely to return much sooner than someone who just finished a 3-hour listening binge.
Critical Insight & Conclusion
The study successfully moves beyond "how many people are logged in" to "how do people integrate music into their lives."
Key Takeaways for Engineers:
- Infrastructure: Resource allocation should account for the disproportionate playback density in the morning.
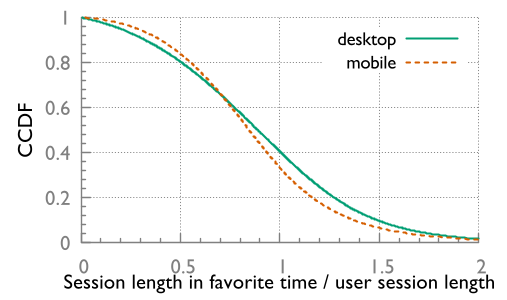
- UX Design: Knowing that 92% of users have a "favorite time" that is different from their "long session time" suggests that Spotify should surface different types of content (e.g., quick podcasts vs. long symphonies) based on the clock.
- Mobile Churn: Mobile users generate higher churn rates due to shorter, more fragmented sessions, requiring more robust session-resumption protocols.
While the data is from the 2011 era, the fundamental discovery—that hardware (Mobile vs. Desktop) dictates the "rhythm" of consumption—remains a cornerstone of streaming service optimization today.