
GO-UDTs: Bridging the Gap Between Clustering and Biological Meaning in Microarray Data
Unsupervised Decision Trees Structured by Gene Ontology (GO-UDTs) for the Interpretation of Microarray Data
The paper introduces Gene Ontology Unsupervised Decision Trees (GO-UDTs), a novel sample-wise clustering method for microarray data. By partitioning samples using the first principal component of specific Gene Ontology (GO) biological process classes, it generates dendrograms that act as interpretable decision trees.
TL;DR
Current clustering methods for gene expression data are "black boxes" that group samples without explaining the biological rationale. GO-UDTs (Gene Ontology Unsupervised Decision Trees) solve this by using biological pathways as the actual features for splitting data. The result is a decision tree where every node is automatically labeled with a Gene Ontology (GO) term, providing a direct clinical and biological narrative for the identified patient subgroups.
Problem & Motivation: The Interpretation Gap
In the world of bioinformatics, we often use unsupervised clustering to find new disease subtypes. However, after getting a dendrogram, a scientist's first question is always: "What biological process makes Group A different from Group B?"
The standard workflow is a two-step process:
- Cluster the samples using all genes.
- Find Differentially Expressed (DE) genes and perform Enrichment Analysis.
The flaw here is that the clustering and the interpretation are decoupled. Global clustering is often driven by "noise" or a mix of heterogeneous signals, meaning the primary biological driver might be obscured. The authors argue that we should use biological knowledge—Gene Ontology—to guide the clustering itself.
Methodology: Building Trees with Biology
The core innovation of GO-UDTs is the adaptation of Unsupervised Decision Trees to use functional gene sets as features.
1. The Splitting Logic
Instead of splitting on a single gene, each node in the tree considers a "Gene Class" (e.g., Lipid Metabolism).
- Dimensionality Reduction: For a given gene class, the algorithm performs PCA on its member genes. The 1st Principal Component (PC1) is used as the representative feature for that class.
- Bimodality Scoring: The method fits two models to the PC1 distribution: a single Gaussian and a mixture of two Gaussians. The Log-Likelihood Ratio (LLR) determines which gene class creates the "cleanest" split (the most natural separation into two groups).
2. Ensuring Stability
To prevent the tree from being sensitive to minor noise, the authors require a "consensus" split. A GO term is only chosen if other related biological processes also support the same sample partitioning.
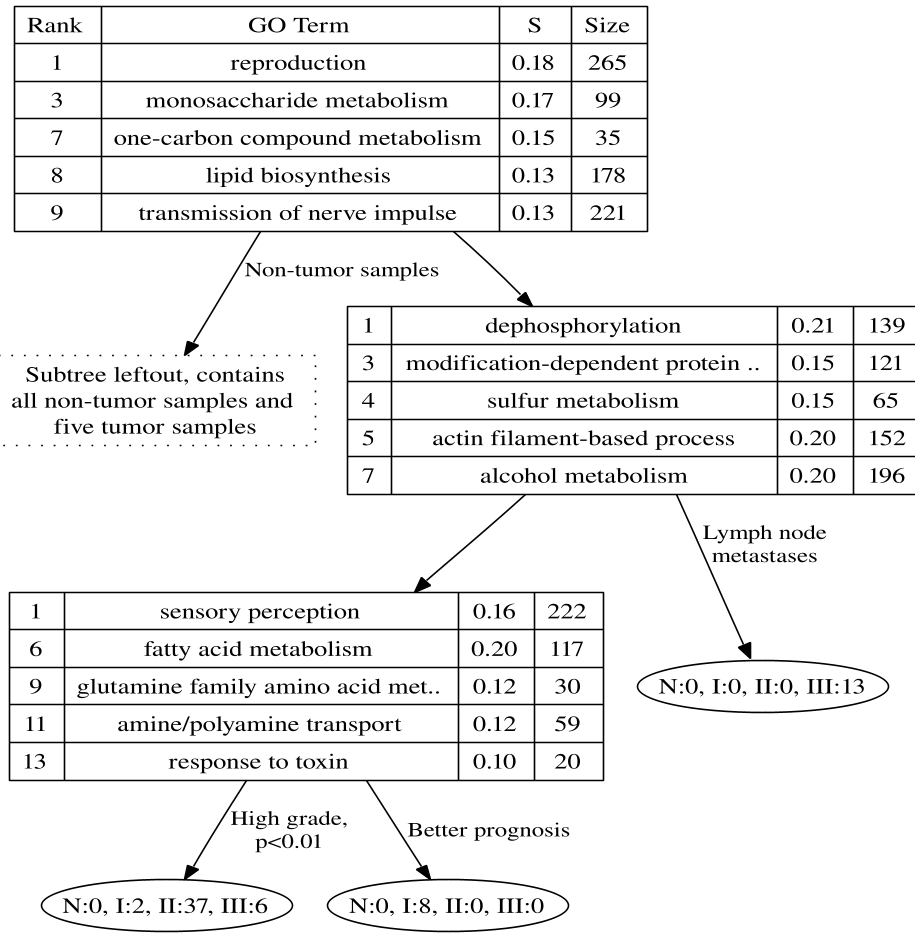 Figure 1: The generated GO-UDT for prostate cancer. Note how every node is labeled with a biological process like 'reproduction' or 'monosaccharide metabolism'.
Experiments & Results: Validating Clinical Relevance
The authors tested GO-UDTs on a prostate cancer dataset containing normal specimens, primary tumors, and metastases.
- Result 1: Accurate Classification. The tree successfully separated normal samples from tumors using the
reproductionGO term. Within the tumor group, it identified a highly aggressive subgroup (Subgroup III) usingdephosphorylationandactin filament based processes. - Result 2: Discovering Biomarkers. Interestingly, one of the genes in the splitting class—actinin-4—is a known biomarker for cancer invasion, validating that the "unsupervised" tree was picking up on real pathological signals.
Why not just use DE analysis?
The paper compares GO-UDTs with standard Over-Representation Analysis (ORA). They found that some gene classes (like nerve ensheathment) have many differentially expressed genes but do not form clear clusters. This proves that presence of DE genes doesn't always imply a structural difference between samples—highlighting why GO-UDTs provide a more robust structural insight.
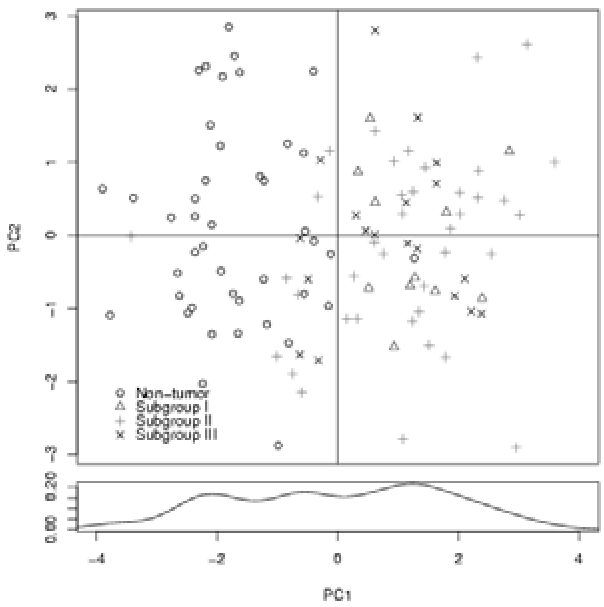 Figure 2: (a) 'Reproduction' shows a clear bimodal split. (b) 'Nerve ensheathment' has DE genes but no clear clustering structure, making it a poor choice for partitioning.
Critical Analysis & Conclusion
Takeaway
GO-UDTs represent a shift from "data-driven" to "knowledge-guided" machine learning. By forcing the model to explain itself using Gene Ontology terms, the authors transform a complex clustering task into an intuitive roadmap for biologists.
Limitations
- Redundancy: GO terms are hierarchical and overlapping, which can lead to redundant information at nodes.
- PCA Simplification: Using only the 1st PC might lose subtle interactions within a gene class that require higher dimensions to manifest.
Future Work
The authors suggest expanding this "ontology-structured" approach to supervised learning. Imagine a diagnostic tool that tells you a patient has a specific cancer subtype because their "Fatty Acid Metabolism" pathway has shifted significantly—bringing us one step closer to truly explainable AI in medicine.