
USDA Model: Tackling Unsynchronized Wearable Data for High-Precision Healthcare
Unsynchronized wearable sensor data analytics model for improving the performance of smart healthcare systems
This paper introduces the Unsynchronized Sensor Data Analytics (USDA) model combined with an RNN-ANOVA architecture to process wearable sensor (WS) data. It specifically addresses data inconsistencies caused by time delays and frequency variations to improve diagnostic accuracy in smart healthcare systems.
TL;DR
The Unsynchronized Sensor Data Analytics (USDA) model provides a robust framework for handling wearable sensor data regardless of time-factor inconsistencies. By combining a predictive analysis module with an RNN-ANOVA hybrid algorithm, the researchers achieved significant boosts in diagnostic accuracy and a marked reduction in computational complexity.
Background & Motivation: The "Chaos" of Wearable Data
In the world of Smart Healthcare, wearable sensors (WS) are the frontline soldiers, capturing ECG, temperature, and humidity. However, the battlefield is messy. Data transmission often suffers from delays, packet loss, and desynchronization due to network traffic or oversized data packets.
The core intuition of the authors is that we shouldn't discard "tardy" or "disordered" data. Instead, we can use the intrinsic correlation between historical and current data states to "fill in the blanks" (missing data) and rectify errors caused by time-frequency variations.
Methodology: The USDA Framework
The USDA model isn't just about collecting data; it's about intelligent reconstruction.
1. The Analytic Logic
The model evaluates medical data () acquired from sensors () by maximizing an accuracy factor () while minimizing delay and frequency errors. It uses a specific formula to identify internal errors (): This allows the system to distinguish between actual physiological changes and simple transmission glitches.
2. RNN-ANOVA Hybrid
To refine the results, the authors employ a Recurrent Neural Network (RNN), which is naturally suited for sequential data like heart rates. By integrating ANOVA (Analysis of Variance) within the hidden layers, the model compares the current state of a neuron with its previous versions to detect and smooth out discontinuous errors.
 Figure 1: The overarching process flow of the USDA model, highlighting the transition from sensing to prediction-based diagnosis.
Experimental Validation
The model was tested against two real-world datasets (Realworld HAR and Daily Log ADL). The benchmark focused on three pillars: Efficiency Score, Time Complexity, and Time Split Instances.
Key Breakthroughs:
- Higher Efficiency: Achieved a 15.36% improvement in efficiency for varying occurrence frequencies.
- Lower Latency: Time complexity was reduced by approximately 11.93% to 23.34%.
- Better Synchronization: The model handles "Time Splits" (instances where data is fragmented) nearly 29% more effectively than previous SOTA methods like EdgeCare and CNN-HM.
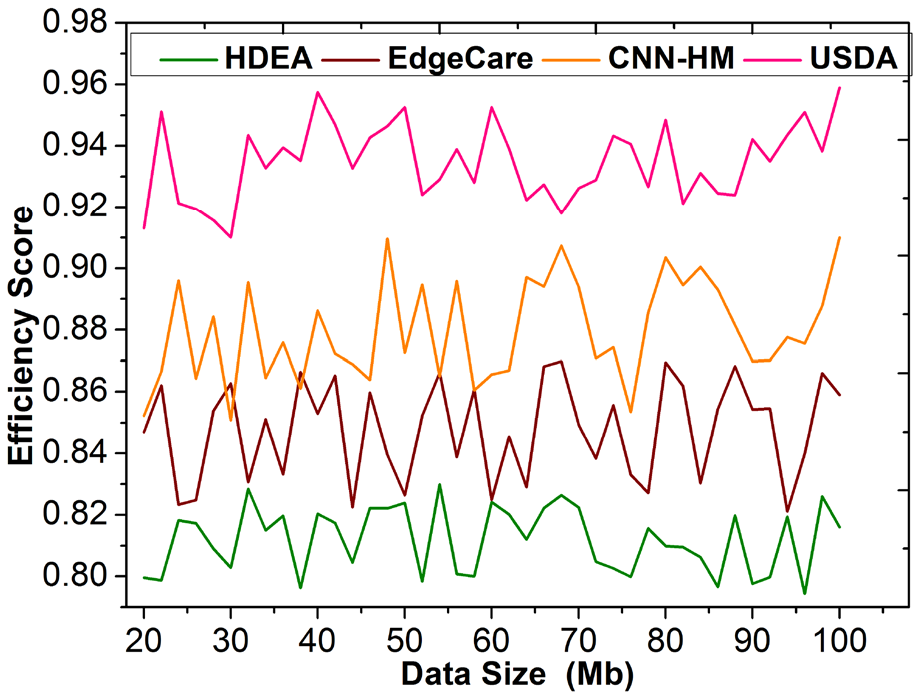 Figure 2: Efficiency score comparison across different datasets, demonstrating the USDA's superiority as data size increases.
Critical Insight & Conclusion
The USDA model represents a shift from "Reactive" to "Predictive" healthcare data management. By acknowledging that network conditions are never perfect, the authors built a system that remains resilient to time-factor volatility.
Takeaway: The integration of ANOVA into the RNN hidden layers is a clever way to handle the "noise" of unsynchronized data. However, future work should address how this model handles extremely high-dimensional data (like 4K video feeds from medical cameras) where the computational overhead of RNN-ANOVA might become a bottleneck at the edge.