
Unveiling the Viral Engine: A Measurement Study of Early Social Network Applications
Unveiling Facebook: A Measurement Study of Social Network Based Applications
This paper presents a pioneering measurement study of third-party applications on the Facebook Developer Platform, analyzing data from three custom-built applications (Fighters' Club, Got Love, Hugged) with over 8 million users. It characterizes the workload, user interaction graphs, and community structures, revealing distinct behavioral differences between social gaming and non-gaming applications.
TL;DR
Long before the current era of "Meta," researchers at UC Davis conducted the first deep-dive measurement study of the Facebook Developer Platform. By launching three applications that reached 8 million users, they discovered that social apps don't just follow the existing social graph—they rewrite it. While non-gaming apps reflect real-world communities, social games create "small-world" webs of strangers, presenting unique challenges for performance and scalability.
Background: The Birth of the Social App Workload
In 2007-2008, Facebook transformed from a directory into a platform. This shift allowed third-party developers to leverage the "Viral Loop." This paper captures the "Gold Rush" era, identifying how social apps became an emerging Internet workload distinct from the web or traditional online gaming.
Analyzing the Macro-Scale: The Power Law of Popularity
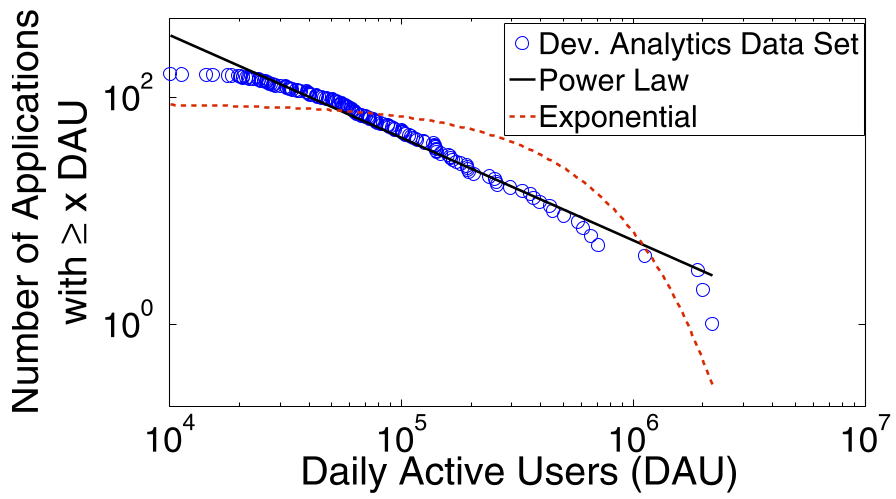
The researchers observed that application popularity is hit-driven. Using data from the top 160 apps, they found a Power-Law distribution with an exponential cutoff.
- Preferential Attachment: Success breeds success. News feeds act as an advertising mechanism where popular apps get more exposure.
- The 80-20 Rule: Approximately 20% of the top applications account for nearly 70% of the daily active users (DAU).
Social Gaming vs. Non-Gaming: A Structural Divide
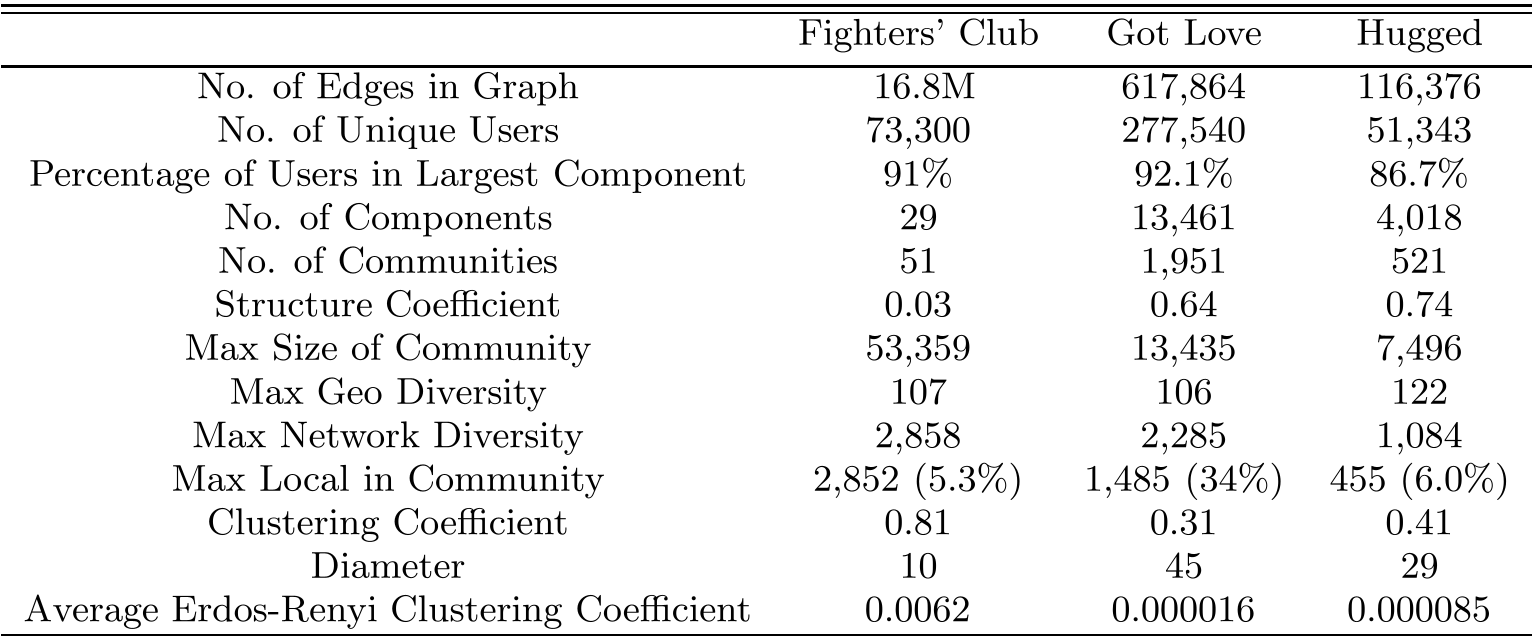
The paper’s core technical contribution lies in its structural analysis of user interaction graphs. It compares Fighters’ Club (FC), a game, with Got Love (GL) and Hugged, which are non-gaming "social utility" apps.
1. The Structure Coefficient (Q)
The study uses the Leading Eigenvector algorithm to extract communities. A coefficient (Q) > 0.3 indicates strong community structure.
- GL and Hugged: Showed high Q values (up to 0.74), meaning users largely interacted within tight-knit friendship circles.
- Fighters’ Club: Showed a measly Q of 0.03. In gaming, players frequently interact with non-friends or "strangers" to advance (e.g., getting supporters for a fight), which erodes the traditional community boundaries.
2. Scalability and Locality
The authors investigated if data could be segregated by geography (e.g., localizing US users on one server). Shockingly, they found that user response times are independent of locality. Whether a user is in London or New York, the average response time was ~15 hours, governed by social rhythms (checking Facebook) rather than network latency.
Why It Matters: The Scalability Trap
The researchers highlight a specific pain point: "The Success Disaster." As Fighters' Club grew, the "viral" nature led to massive bursts of traffic that crippled cheap server solutions. Since gaming activity is driven by the fraction of subscribing friends rather than just total user count, social games require a massive "warm-up" but exhibit incredible persistence once the social threshold is reached.
Critical Analysis & Conclusion
The paper concludes that Facebook's internal "network" definitions (School, Work) fail to capture actual app interaction. For developers, this means that optimizing for scalability requires understanding the specific "Interaction Graph" of the app, not just the underlying social graph.
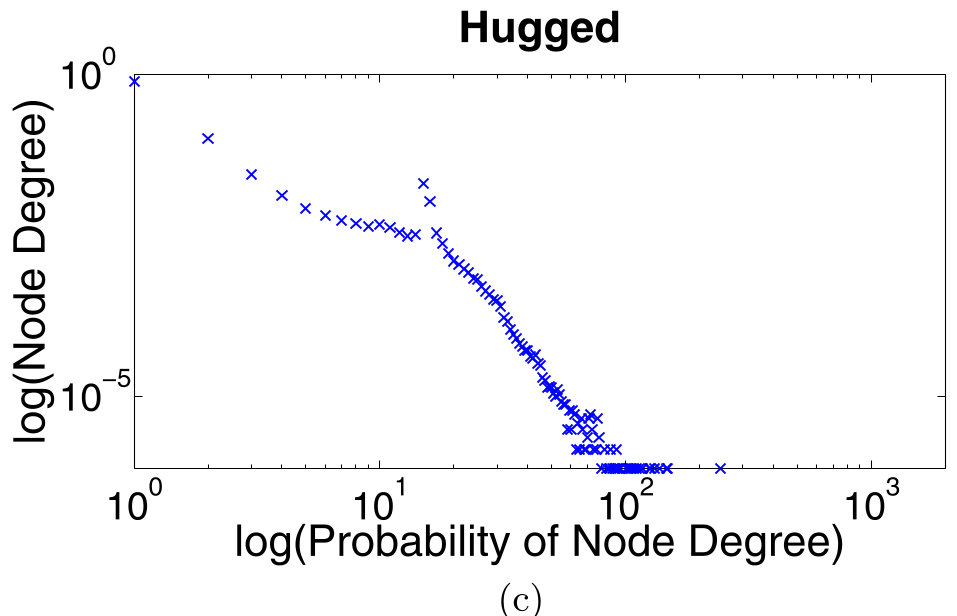
Key Takeaway: In social gaming, the "viral" spread creates a dense, small-world network that behaves differently from traditional social groups. To scale these systems, one must look beyond geography and focus on clustering coefficients within the interaction data itself.
Limitations: As a 2008 study, it focuses on pull-based HTTP/TCP traffic. Modern social apps now utilize real-time WebSockets and push notifications, which would significantly compress the 15-hour response times noted here.