
Unveiling the Hidden Pulse of Photonics: A Techno-Economic Intelligence Approach
Unveiling Latent Relations in the Photonics Techno-Economic Complex System
This paper introduces a multidimensional analytical framework to map the techno-economic segment (TES) of the Photonics industry. By combining Multilayer Network (MLN) community detection with Latent Dirichlet Allocation (LDA) topic modeling, the researchers identify latent relationships among global R&D agents (companies and institutions) and uncover emerging technological subdomains from patent and EU-funded project data.
TL;DR
Understanding the trajectory of a complex technology like Photonics requires looking beyond traditional industry codes. This study proposes a novel framework that layers collaborative networks with semantic topic modeling to reveal "latent" connections between global innovators. By analyzing EU projects and patents from 2008–2016, the researchers have mapped the "meso-structures" of the Photonics landscape, showing exactly where applications like fiber optics bridge into methodological foundations like quantum physics.
Background: Why Traditional Metrics Fail High-Tech
Emerging technologies don't respect boundaries. They are "Techno-Economic Systems" where a discovery in a university lab in Germany might find its commercial application in a Japanese electronics firm. Prior work often relied on rigid product classifications that miss the "bottom-up" evolution—the real interactions between agents, locations, and ideas. The motivation here is to provide a "sensor" for technological pathways that identifies potential innovations before they hit the mass market.
Methodology: The Multilayer & Semantic Engine
The researchers developed a dual-track methodology to capture both the structure of interactions and the content of the technology.
1. The Multilayer Network (MLN)
Instead of a simple social network, the authors built a three-layer graph:
- Activity Layer: Direct collaboration in EU projects or co-patenting.
- Proximity Layer: Shared geographical regions (exploiting the "Industrial District" effect).
- Functional Layer: Shared use of specific technological terms.
By using the Infomap Algorithm on this MLN, they could find clusters of agents who are intensely exchanging information, even if they aren't directly working on the same project yet.
2. Topic Modeling via LDA
To understand what these agents are doing, the authors applied Latent Dirichlet Allocation (LDA) to a corpus of R&D documents. This identified "thematic groups" (topics) that categorize the technology into application-oriented (e.g., LED displays) or method-oriented (e.g., physical foundations) domains.
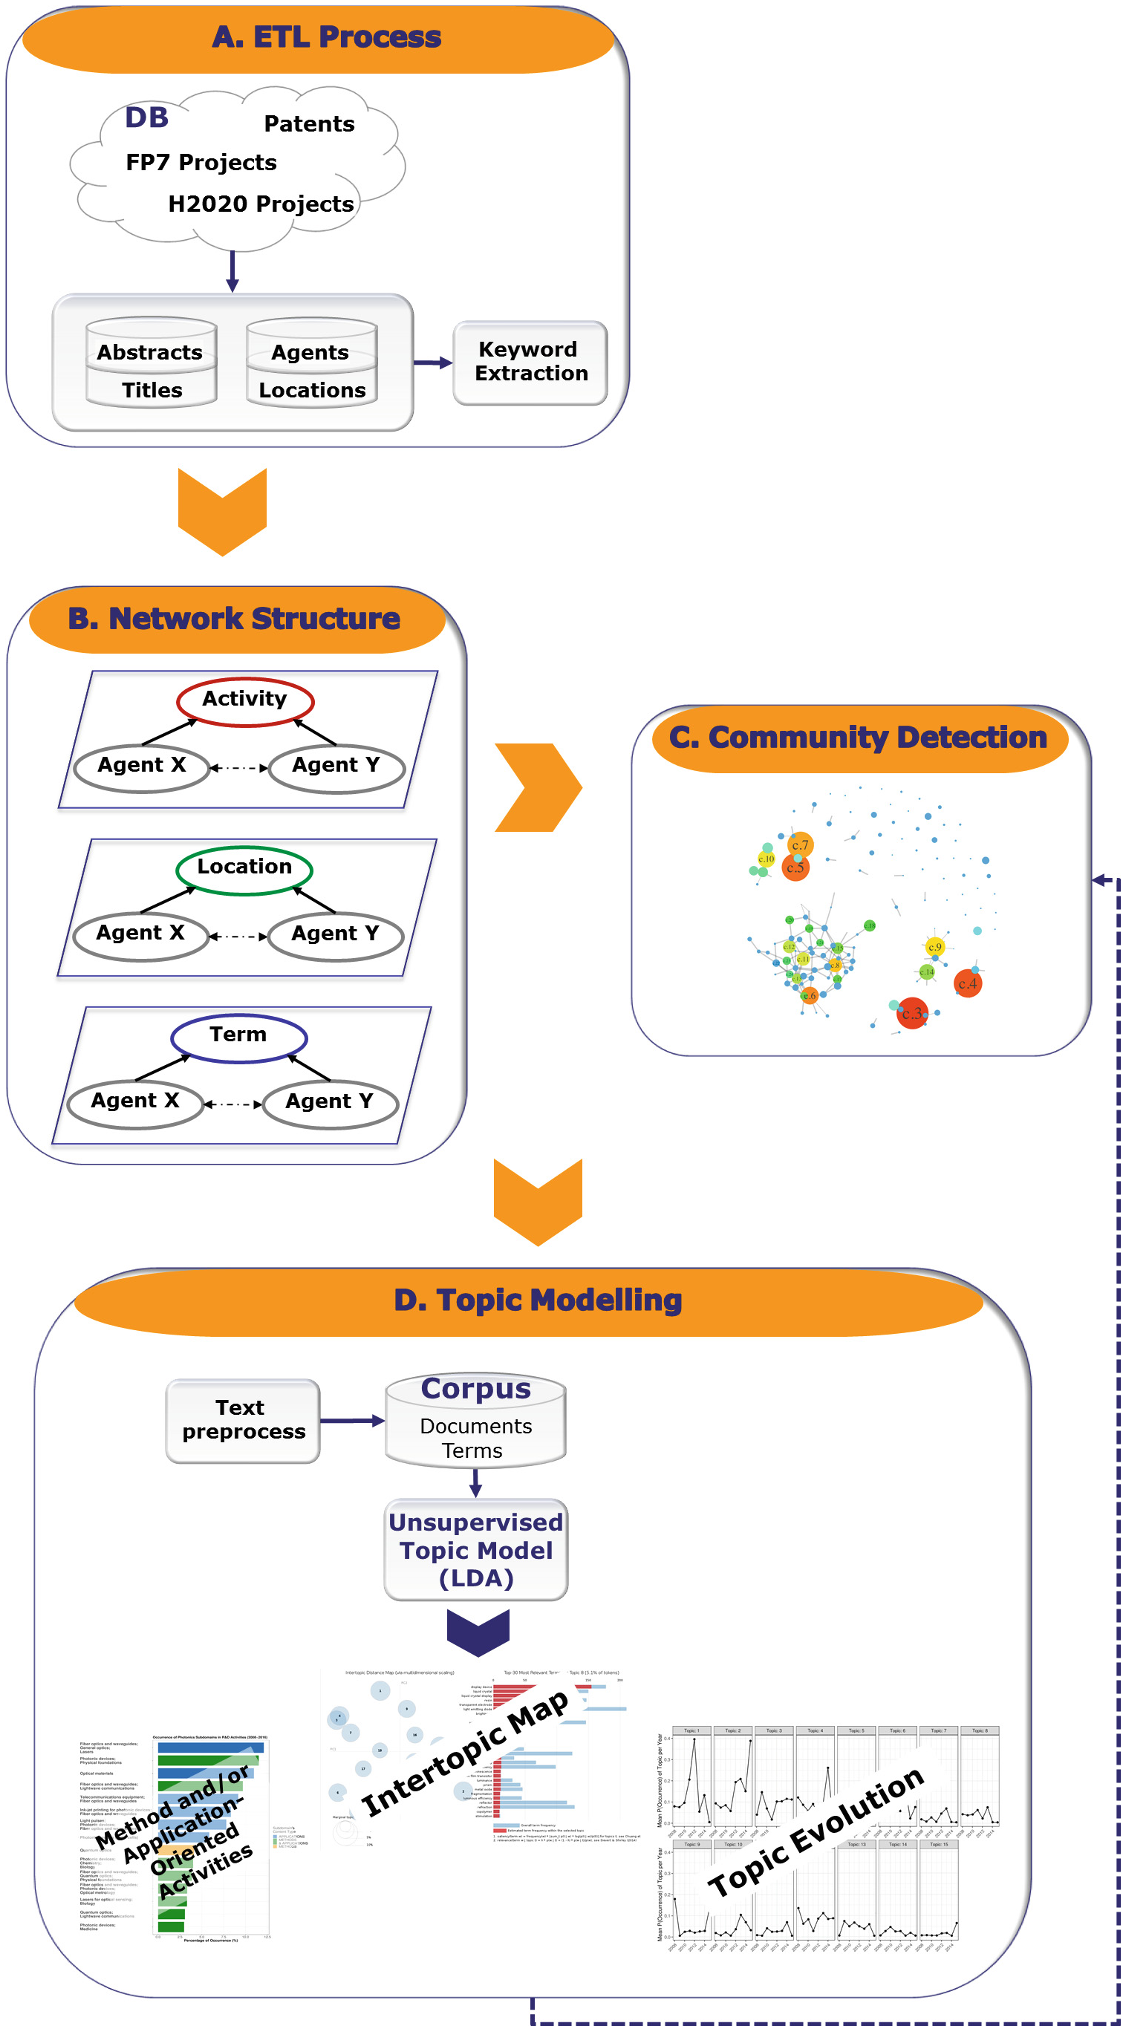 Figure 1: The schematic workflow showing the integration of network structure and semantic topic modeling.
Key Insights from the Photonics Landscape
Community Structural Differences
The analysis of 100+ communities revealed fascinating geographic split:
- Europe: Highly interconnected, supranational clusters where agents from different countries (DE, IT, FR, UK) frequently mix.
- Japan and China: Showed a high propensity for patents but tended to form more isolated or specialized communities (e.g., Japanese agents were primarily concentrated in community c.3).
The Dominance of "Topic 2"
The study identified 15 key topics. The most prevalent was Topic 2, a multidisciplinary powerhouse combining fiber optics, general optics, and lasers. Interestingly, the data suggests that application-oriented subdomains (solving specific end-user problems) occur more frequently than method-oriented ones, implying that the Photonics ecosystem is currently driven by application "pull" rather than basic research "push."
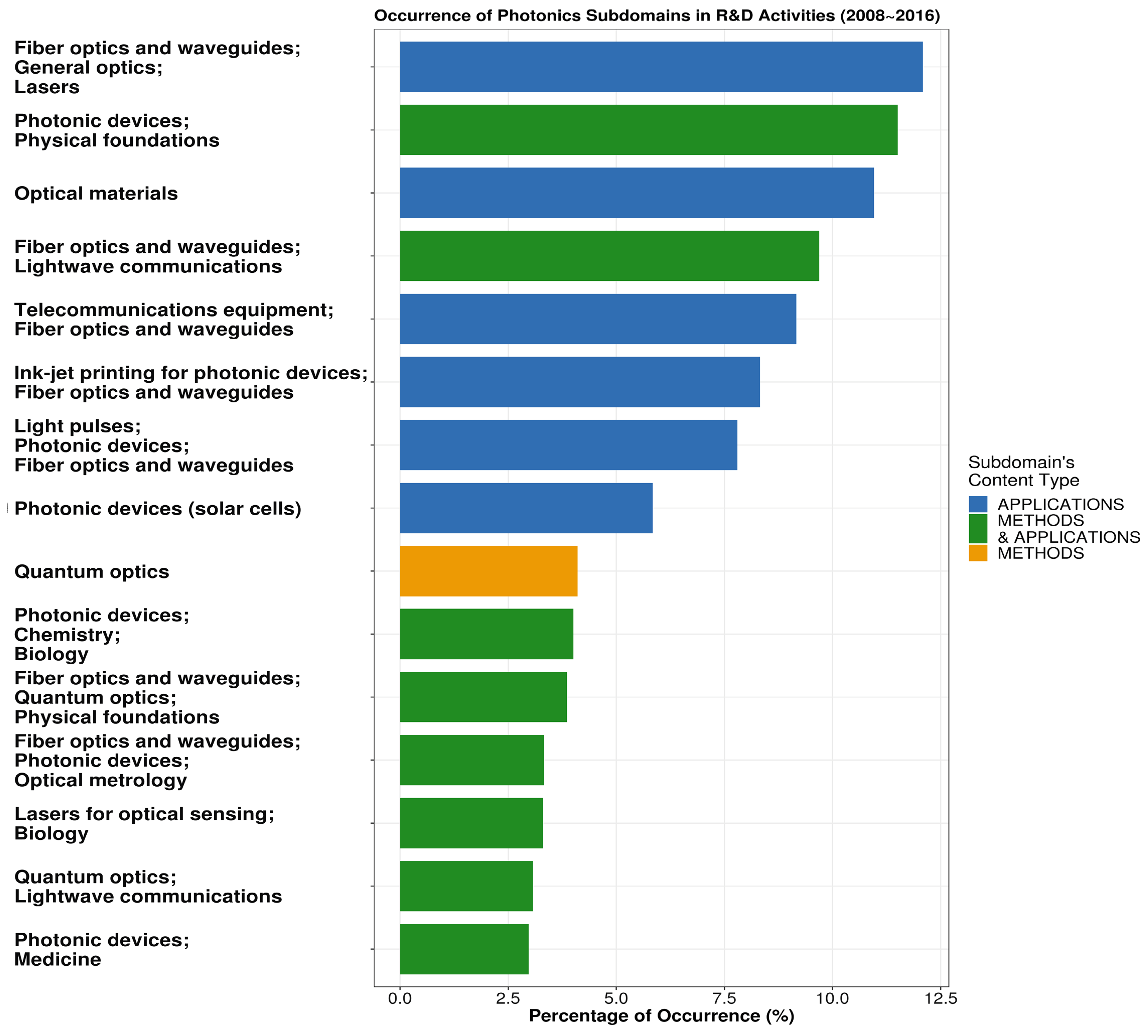 Figure 2: Ranking of topics by occurrence. Red/Blue bars denote descriptive power and relevance across the corpus.
Why This Matters: Predicting the Future
The real power of this method lies in Topic Distances. By calculating the Jensen-Shannon divergence between topics, we can see which fields are "drifting" toward each other. For instance, the overlap between "Photonic Devices" (Topic 3) and "Optical Materials" (Topic 6) suggests a future where these independent fields might merge into a single multidisciplinary domain.
Critical Analysis & Conclusion
Takeaway
The value-add of this research is its ability to turn "messy" unstructured text from patents and grants into a strategic map. It moves beyond "who is working with whom" to "who should be working with whom based on their semantic and geographical footprint."
Limitations & Future Work
The authors acknowledge a "registration lag" in patent data for the 2014–2016 period, which may skew recent trends. Future research aims to automate the "Extract-Transform-Load" process even further and expand the methodology beyond R&D to include non-R&D market activities (production, sales), providing a true end-to-end view of the techno-economic complex.