
Urban Social Sensors: Mastering Situational Awareness via Clock-Face Visualization
Situation monitoring of urban areas using social media data streams
The paper presents a visual analytics system for real-time urban situation monitoring using Twitter users as "social sensors." By combining Latent Dirichlet Allocation (LDA) for topic modeling, IDF-shift based event detection, and a hierarchical clock-face visualization, the system successfully tracks topics and sentiments across spatial and temporal dimensions.
TL;DR
Researchers from the University of Konstanz have developed a system that transforms the chaotic Twitter stream into a structured, visual "clock" for urban monitoring. By separating what's happening inside a city from what the world is saying about it, they've created a tool that identifies major events (like the Boston Marathon bombing) almost instantly, providing both the topical "what" and the emotional "how."
The "Social Sensor" Logic
The core philosophy of this work is treating humans as "social sensors." Every tweet is a data point enriched with spatio-temporal metadata and sentiment.
The problem with prior SOTA (State Of The Art) methods was their dimensionality. Analysts often struggled to see:
- Temporal Evolution: How did the event unfold minute-by-minute?
- Spatial Context: Is this a local disaster reporting from the ground, or global chatter/sympathy from afar?
- Topic vs. Sentiment: A high volume of tweets about "Boston" is meaningless unless we know if the sentiment is "celebratory" (marathon finish) or "tragic" (explosion).
Methodology: The Hierarchical Clock-Face
The system processes data through a sophisticated pipeline using Niagarino, a stream management system.
1. Spatial Bifurcation
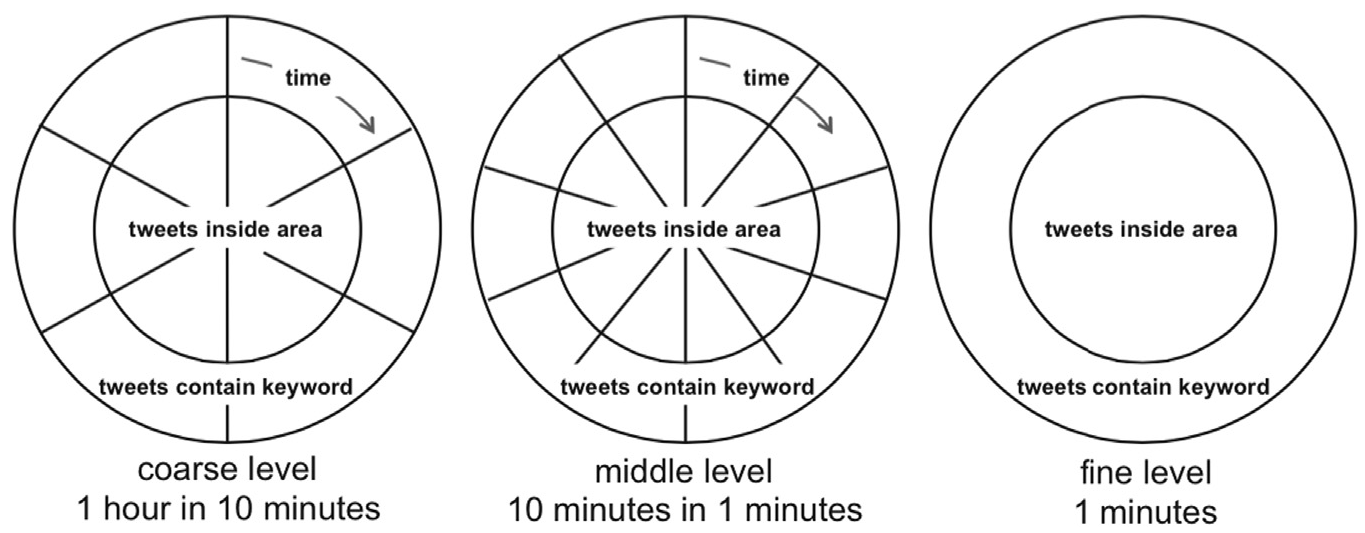
The visualization splits each time slice into:
- Inner Circle: Tweets originating geographically within a radius (e.g., 20 miles) of the city center.
- Outer Ring: Tweets mentioning the city keywords but sent from outside the geographic area.
2. The Clock METAPHOR
Time is represented as 10-minute slices within an hour-long "clock face."
3. Topic & Event Fusion
The system doesn't just use LDA (Latent Dirichlet Allocation) for topics; it employs a dedicated Event Detection phase. It monitors shifts in IDF (Inverse Document Frequency). When a term's frequency spikes abnormally relative to its history, it is flagged as an "event" and highlighted in purple within the Tag Cloud to grab an analyst's attention.
Critical Evidence: Case Study Insights
The paper showcases several powerful case studies. The most compelling is the Boston Marathon (2013) analysis.
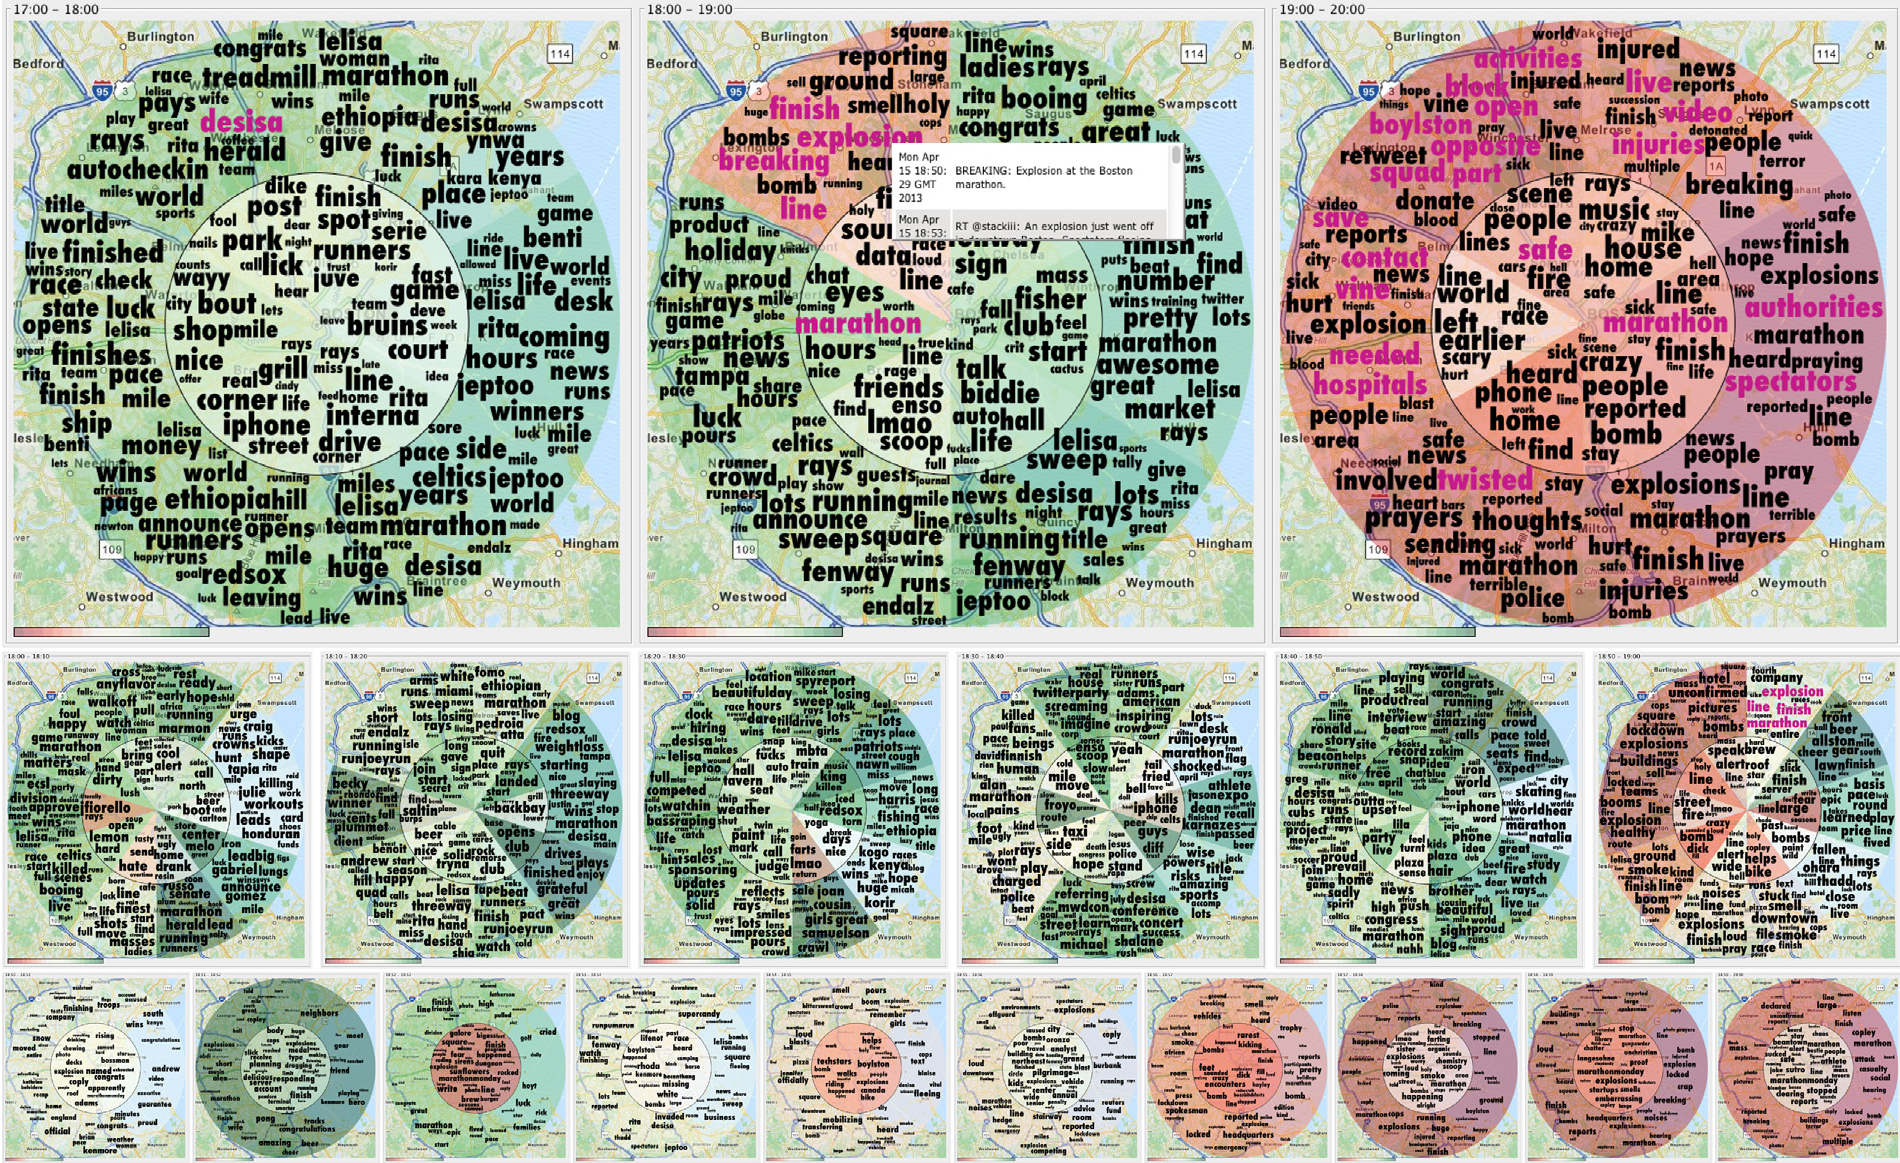
- The Shift: At 6:50 PM UTC, the sentiment (color-coded) shifted from "Positive/Neutral" (green/white) to "Negative" (red) within minutes.
- Observation: Global chatter ("Outside") reacted almost simultaneously with local reporting, but local tweets provided the granular "on-site" details that analysts need.
- Drill-down: The hierarchy allows a user to "click" into an hour to see 10-minute slices, and then into a 1-minute granularity for frame-by-frame analysis of the sentiment drift.
Experimental Validation
A web-based user study (n=54) confirmed the utility:
- Sentiment Recognition: 70% accuracy.
- Event Detection: Most users successfully identified the exact 10-minute window an event started.
- Expert vs. Novice: Interestingly, the study showed that "trained" users (those given a brief tutorial) performed significantly better, suggesting this is a high-value tool for professional analysts rather than a casual dashboard.
Critical Analysis & Future Outlook
Why it works: The primary "Win" here is the Spatial Separation. Monitoring Washington D.C. revealed that global frustration with "Government Shutdowns" often creates a negative "Outside" ring, even when "Inside" city life is neutral. Without this separation, local events would be drowned out by "Global Noise."
Limitations:
- The red-green color scale is a barrier for daltonism (color blindness).
- The reliance on keyword matching for the "Outside" ring can lead to false positives (e.g., people tweeting about "Denver" the dog).
The Takeaway for the Industry: As we move toward "Smart Cities," integrating social sensors with traditional IoT (traffic cams, acoustic sensors) will be the standard. This paper provides the visual vocabulary—the Hierarchical Clock-Face—that allows us to digest "Big Stream" data without drowning in it.
Conclusion
Weiler et al. offer a robust framework for situational awareness. By treating social media not just as text, but as a geo-temporal signal, they bridge the gap between "what's trending" and "what's happening."