
Decoding the City's Pulse: How Cyber-Physical Crowds Reveal Urban DNA
Exploring Reflection of Urban Society through Cyber-Physical Crowd Behavior on Location-Based Social Network
The paper introduces a method to extract urban characteristics by analyzing "Cyber-Physical Crowd Behavior" using geo-tagged lifelogs from Location-Based Social Networks (LBSN). By applying Non-negative Matrix Factorization (NMF) to Twitter data, the authors successfully clustered urban regions in Japan (Kinki region) based on temporal behavioral patterns, correlating them with physical facilities like offices and restaurants.
TL;DR
Researchers have developed a way to "read" the character of a city not by looking at its buildings, but by listening to its digital heartbeat. By analyzing geo-tagged Twitter data through Non-negative Matrix Factorization (NMF), this study uncovers how the daily rhythms of "Cyber-Physical Crowds"—people bridging the real and digital worlds—reveal whether a neighborhood is a bustling business hub or a vibrant dining district.
Background: Beyond Bricks and Mortar
What defines a city? Is it the skyscrapers (the "Image of the City" as Kevin Lynch proposed) or is it the people? Traditionally, urban planners looked at static maps. Later, web mining looked at textual descriptions. However, this paper argues for a third way: the Cyber-Physical Crowd.
The core insight is that as we share our lives on Location-Based Social Networks (LBSN), we act as "social sensors." Our movement patterns and tweet frequencies create a digital signature that reflects the underlying functional purpose of the urban space.
Methodology: The "Secret Sauce" of Behavioral Vectors
The researchers didn't just look at where people tweeted, but when and how many. They defined three primitive measures:
- #Tweets: Activity level (how much is being said).
- #Crowd: Scale (how many distinct people are there).
- #MovCrowd: Mobility (how much people are moving through).
They segmented the day into eight 3-hour windows and created Crowd Behavioral Vectors (CBV). To make sense of this massive, multi-dimensional data, they employed Non-negative Matrix Factorization (NMF).
Why NMF?
NMF is powerful because it breaks down complex data into "interpretable parts." Unlike other methods, it ensures all factors are positive, which aligns with physical reality (you can't have "negative" crowds). It decomposes the city-behavior matrix () into:
- Matrix W: Which regions belong to which latent features.
- Matrix H: What the behavioral "signature" of each feature looks like over 24 hours.
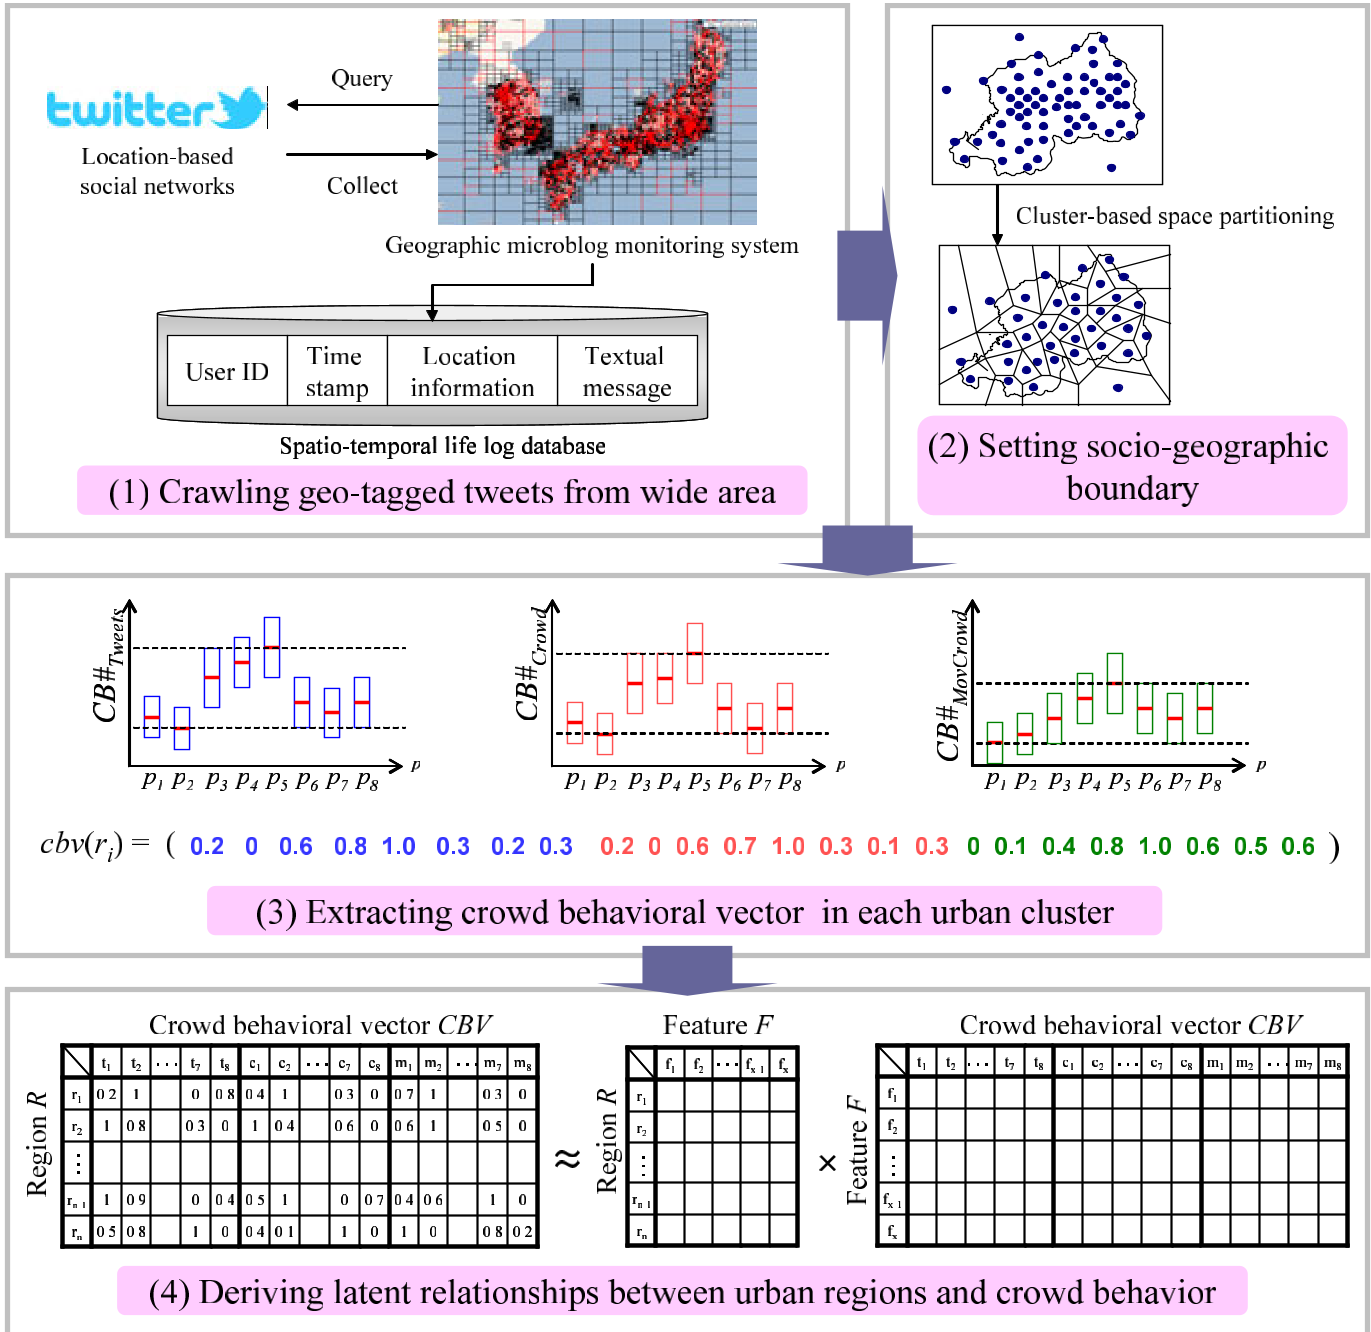 Figure 1: The workflow from collecting tweets to NMF-based pattern extraction.
Experimental Insights: The Kinki Region Study
The team analyzed over 75,000 tweets from the Osaka/Kinki region in Japan. By partitioning the area into 145 clusters (using Voronoi diagrams), they discovered 13 latent behavioral patterns.
Case Study: Work vs. Food
The most compelling part of the study is the "Reasoning" phase. They compared their digital clusters with real-world facility data (from Yahoo! Japan Loco).
- The "Work" Pattern (): Regions in this cluster showed a spike in activity between 15:00 and 18:00 (the end of the workday/school day). Radar charts confirmed these areas had a high density of offices and schools.
- The "Food" Pattern (): Regions showed increased crowd scale during late evening (21:00-24:00). Unsurprisingly, these areas were packed with restaurants and cafeterias.
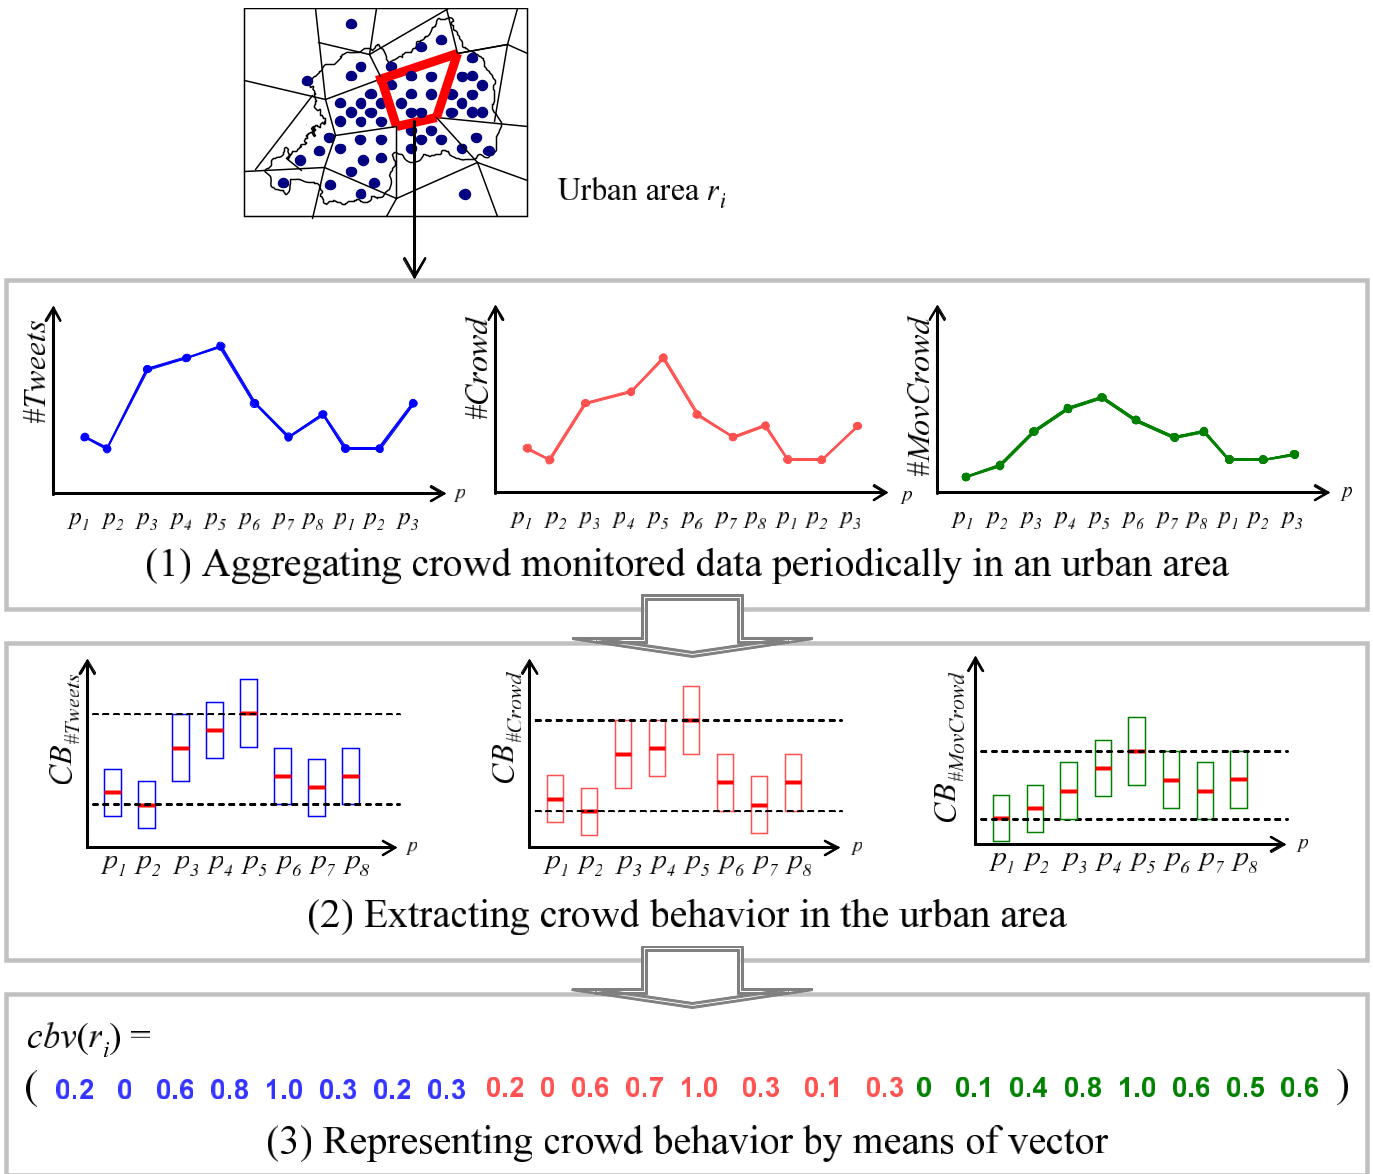 Figure 2: Heatmap showing the 13 latent feature classes (f1-f13) and their temporal signatures.
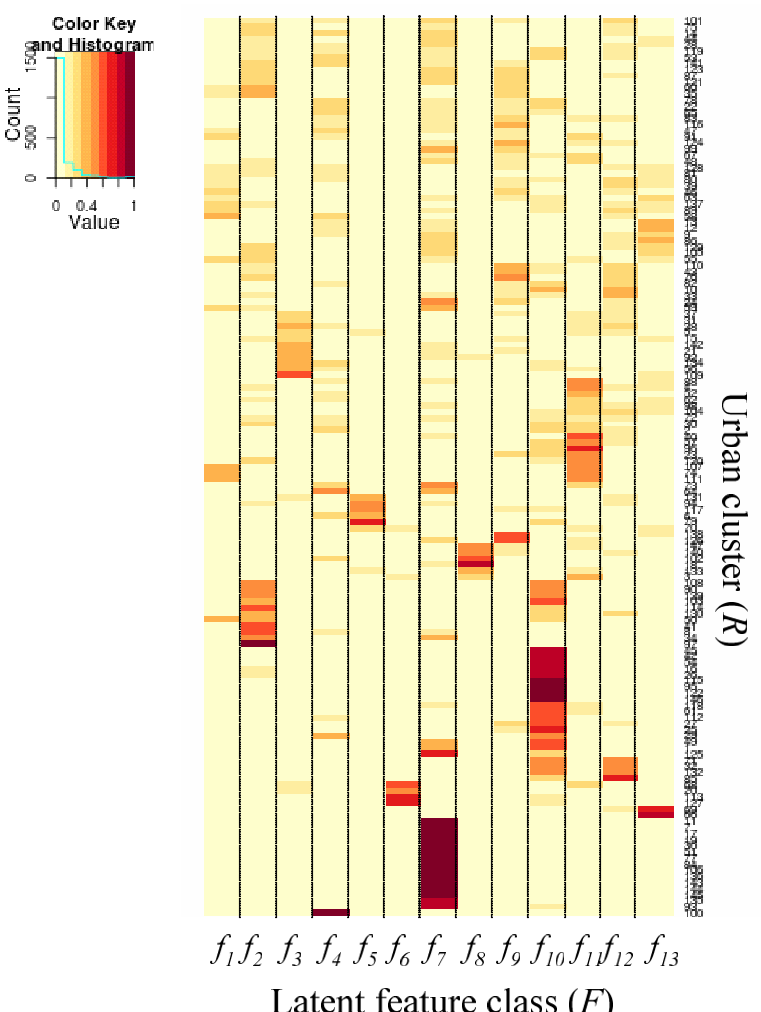 Figure 3: Radar charts showing how behavioral clusters align with physical categories like 'Work' and 'Food'.
Critical Analysis & Conclusion
Takeaways
The study proves that LBSN data is not just "noise"—it is a structured reflection of urban society. The use of NMF provides a mathematically rigorous yet intuitively explainable way to categorize urban functions without manual surveys.
Limitations
- Demographic Bias: The study relies on Twitter users, who might represent a younger or more tech-savvy demographic, potentially skewing the "image" of the city.
- Temporal Resolution: 3-hour windows are useful but might miss granular "micro-events" like a 30-minute flash mob or a sudden traffic jam.
Future Outlook
This work paves the way for Practical Urban Life Support Systems. Imagine a city dashboard that detects shifts in "Cyber-Physical" density in real-time, allowing for dynamic public transport adjustments or smarter emergency responses. The city is no longer a static map; it is a living, breathing, and tweeting organism.