
Road Networks as Social Webs: A Deep Dive into US Infrastructure via SNA
Study of the US road network based on social network analysis
This paper applies Social Network Analysis (SNA) to large-scale road networks in California, Pennsylvania, and Texas. Leveraging the Apache Spark ecosystem (GraphX, MLib, and Streaming), the authors treat intersections as nodes and roads as edges to identify community structures through K-means clustering and centrality metrics.
TL;DR
This research re-imagines the vast US highway system not as mere pavement, but as a complex social network. By applying Social Network Analysis (SNA) and Apache Spark to the road networks of California, Pennsylvania, and Texas, the authors demonstrate how intersections function like "influencers" and neighborhoods form "communities" through distributed K-means clustering and PageRank algorithms.
Perspective: The Infrastructure is the Network
In the world of Big Data, the distinction between a "social network" and a "physical network" is blurring. This paper positions road network analysis as a graph theory challenge. Why does this matter? Because treating roads like social webs allows us to pinpoint critical points of failure and hidden hierarchies that simple maps cannot reveal. The study focuses on three massive datasets—roadNet-CA, roadNet-PA, and roadNet-TX—containing millions of nodes and edges.
Methodology: The Spark Powerhouse
To handle millions of data points, the authors utilized a high-performance stack: Ubuntu + Spark + HDFS.
1. Structural Centrality and PageRank
The researchers didn't just look at where roads go; they looked at power. By using PageRank, they treated intersections like "important web pages." If an intersection is connected to many other important roads, its PageRank score rises. They discovered a direct correlation: as the Degree Centrality (number of connecting roads) increases, so does the node's PageRank, marking these as critical hubs for state-wide commerce and emergency response.
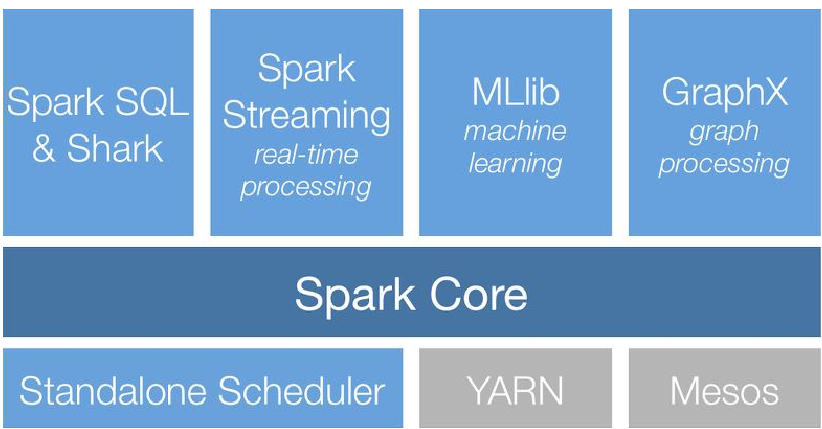 Fig 1: The visual distribution of nodes for California, Pennsylvania, and Texas reveals dense "backbone" structures in urban areas.
2. Community Detection via K-means
The core of the methodology lies in Clustering. Using Spark’s MLlib, the team applied K-means to partition the road network into communities.
- The Physics of the Equation: The goal was to minimize the squared Euclidean distance between road points and their assigned centroid : This effectively groups the state's roads into "functional neighborhoods," even if those neighborhoods span hundreds of miles.
Key Experimental Results
The study provided a comparative performance analysis of different states:
- California (CA): Boasts the largest dataset with 1,965,206 nodes.
- Connectivity Dominance: Pennsylvania's top 10 road endpoints showed significantly higher PageRank values compared to Texas, suggesting a more "interconnected" and perhaps more efficient hub-and-spoke layout in PA.
- Clustering Visualization: The K-means results for California (where and ) clearly identified regional clusters that suggest economic and traffic "communities."
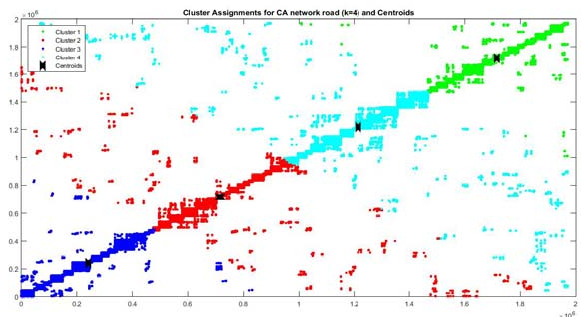 Fig 2: K-means clustering (k=4) on the California road network identifies major regional hubs denoted by the cross markers.
Critical Insight: Limitations & Future Paths
While the K-means approach is robust and fast ( complexity), the authors concede a major limitation: K must be known beforehand. In real-world urban growth, the number of communities is dynamic, not fixed.
The paper concludes that while road networks are planar and mathematically constrained compared to the "it's a small world" density of Facebook or Twitter, applying SNA metrics like Betweenness Centrality allows planners to identify exactly where a network would "break apart" during a disaster.
Final Takeaway
By moving beyond static maps and embracing distributed graph computing, we can treat our cities as living organisms. This Spark-based framework provides a blueprint for real-time disaster mitigation and infrastructure optimization in the era of smart cities.