
Decoding the Digital Tribes: A Data Mining Approach to PTT BBS Relationships
The analysis of user behavior and relationship on Bulletin Board System
This paper presents a comprehensive analysis of user behavior and community relationships on PTT, Taiwan's largest Bulletin Board System (BBS). By utilizing a custom PHP crawler and MySQL-based data mining of 3.4 million articles, the authors successfully map the unique social network structure and temporal activity patterns of Taiwanese youth.
TL;DR
Researchers from National Cheng Kung University have successfully mapped the social DNA of PTT, the largest BBS in Taiwan. By mining 3.4 million articles and nearly 10 million comments, the study reveals how digital communities are structured in a text-only environment, identifying "Gossiping" as the platform's central sun and quantifying the overlaps between professional, gaming, and social boards.
Background: The Persistent Power of the BBS
While the global trend moved toward visually-driven social media like Instagram or Facebook, Taiwan’s youth remained loyal to the Bulletin Board System (BBS), specifically PTT. With over 15 million registered users and peak daily logins exceeding 100k, PTT represents a massive, yet scientifically underserved, social network. Unlike modern platforms, PTT has no formal "friend" system, making the task of identifying social structures a challenge of pure behavioral mining.
Methodology: From Raw Text to Relational Graphs
The research team deployed a multi-stage pipeline to transform PTT’s terminal-based data into actionable insights:
- Data Acquisition: A PHP-based crawler established HTTPS connections to the PTT web interface, parsing historical data into a MySQL database.
- Temporal Analysis: User activity was plotted over 24-hour cycles to identify demographic "signatures."
- Relational Modeling: To calculate the strength of the bond between two boards (A and B), they used the formula: This created a directional relationship, showing how likely a user of one board is to frequent another.
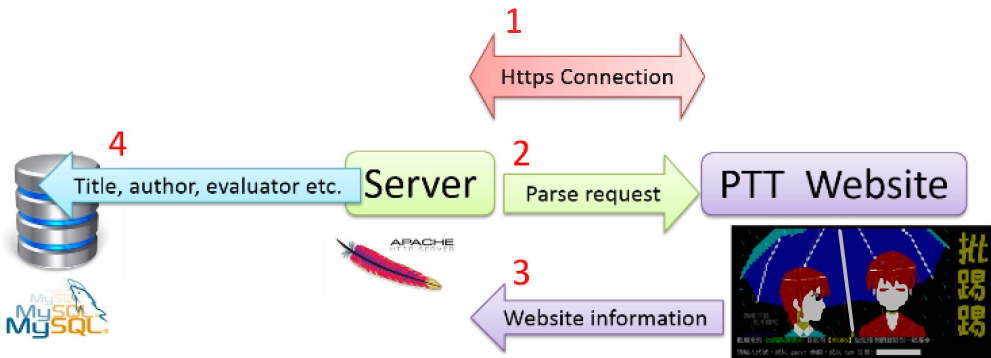 Figure 1: The architecture of the gathering and storage system.
Key Insights: Social Signatures on the Board
1. The Student Silhouette
The activity peaks (10:00 AM to dawn) across all boards align perfectly with the sleep cycles of Taiwanese university students. Interestingly, the "LOL" (League of Legends) board showed a unique dip after midnight—not because users went to bed, but because they shifted from discussing the game to actually playing it.
2. The "Gossiping" Gravity
The "Gossiping" board acts as a gravitational center. The study found that users from almost every other niche board (Stock, Tech-Job, Sex) eventually converge on Gossiping. This makes it a "Low Homogeneity" board—a town square rather than a specialized community.
3. Professional Sub-Communities
The data revealed a strong directional link (0.20) from Soft-Job to Tech-Job, suggesting that programmers see themselves as a subset of the broader tech industry. Conversely, entertainment boards (like Puzzle & Dragons) showed minimal overlap with professional boards, indicating a clear "context switch" in user behavior.
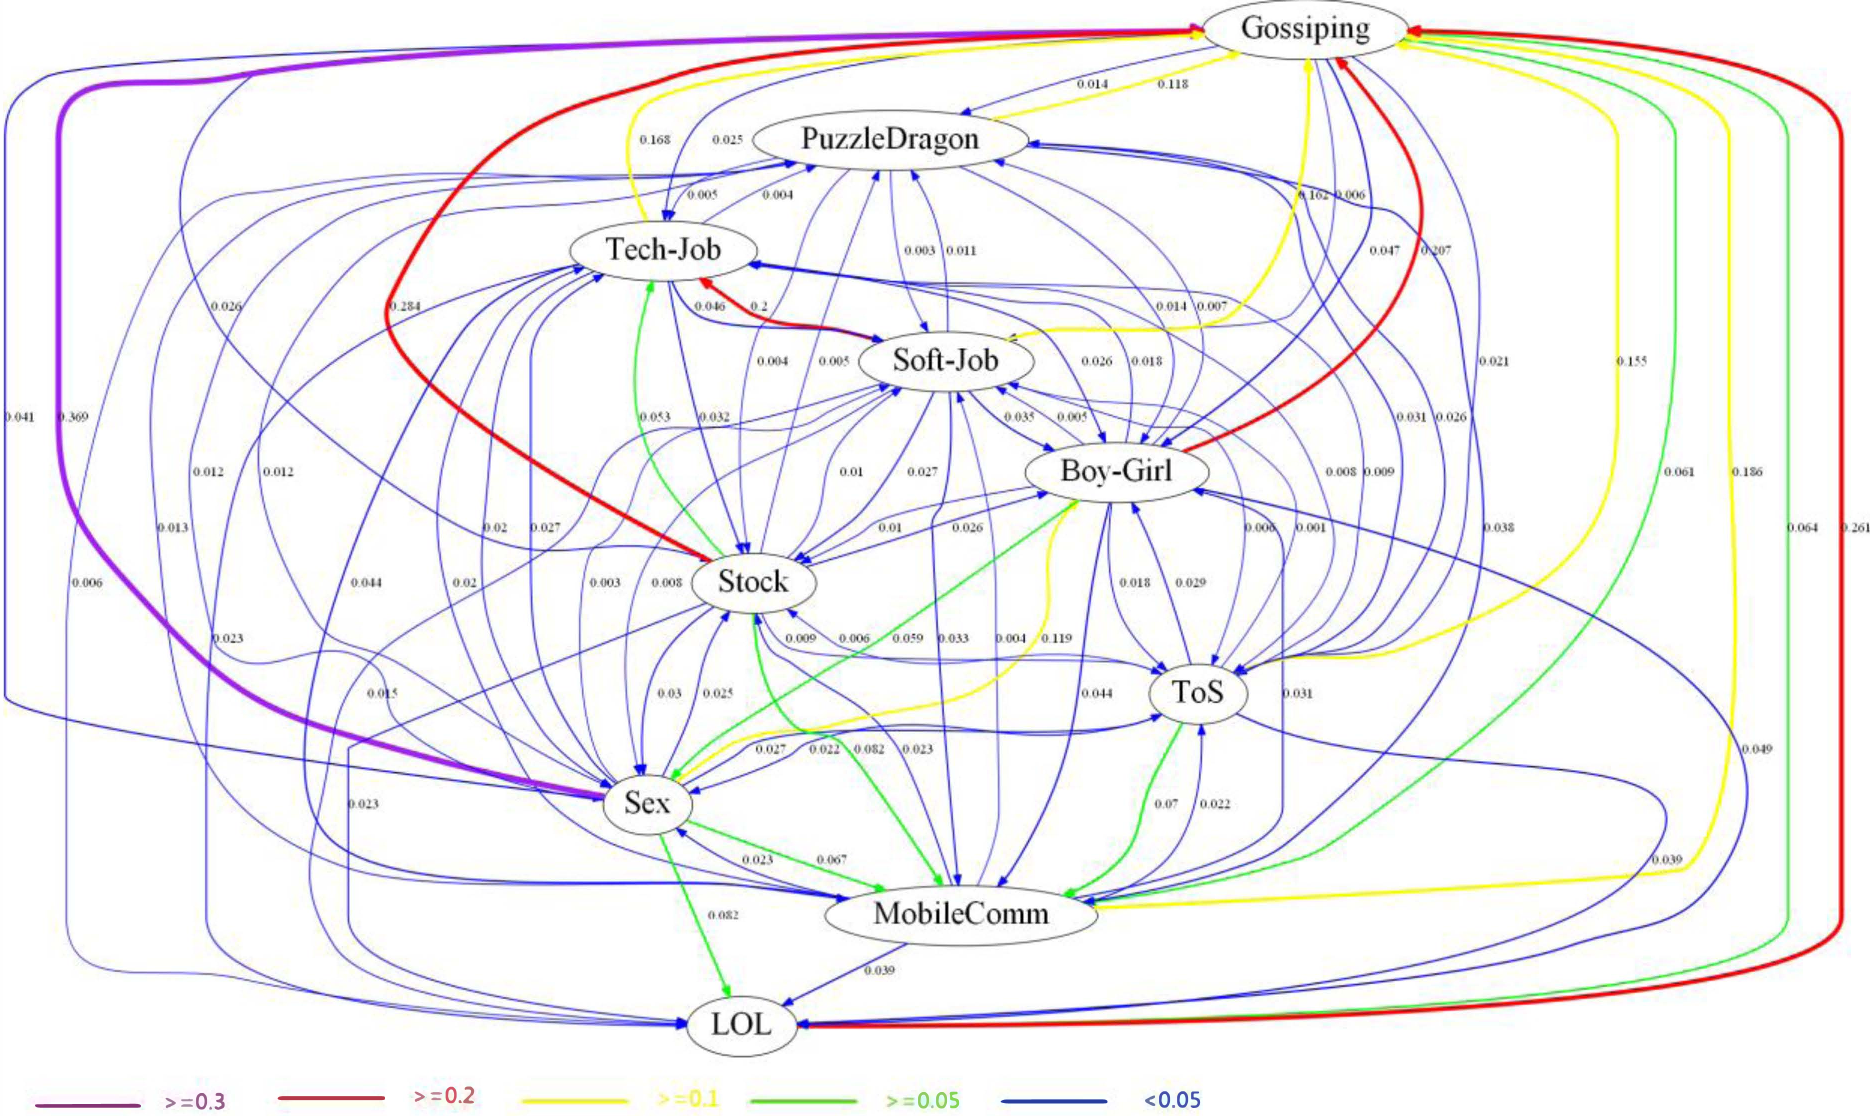 Figure 2: Graphviz visualization illustrating the strength of ties between different PTT communities.
Critical Analysis: The Limits of Likert-style Voting
A fascinating segment of the paper examines individual "Famous Users" (e.g., obov, F7). By tracking "Boos" and "Likes," the authors tried to map interpersonal relationships. However, they noted a classic problem in digital sociology: some users give both high likes and high boos to the same author, suggesting a "love-hate" or "trolling" relationship that simple arithmetic cannot decode.
Future Outlook
The authors admit that a more precise formula is needed to account for the varying sizes of different boards. However, the current work provides a foundational framework for a BBS Recommendation System. By understanding the "directional relation" between boards, PTT could guide new users toward communities that match their behavioral profile, effectively modernizing the "nostalgic hobby" of BBSing for the big data era.
Summary Table of Board Overlaps
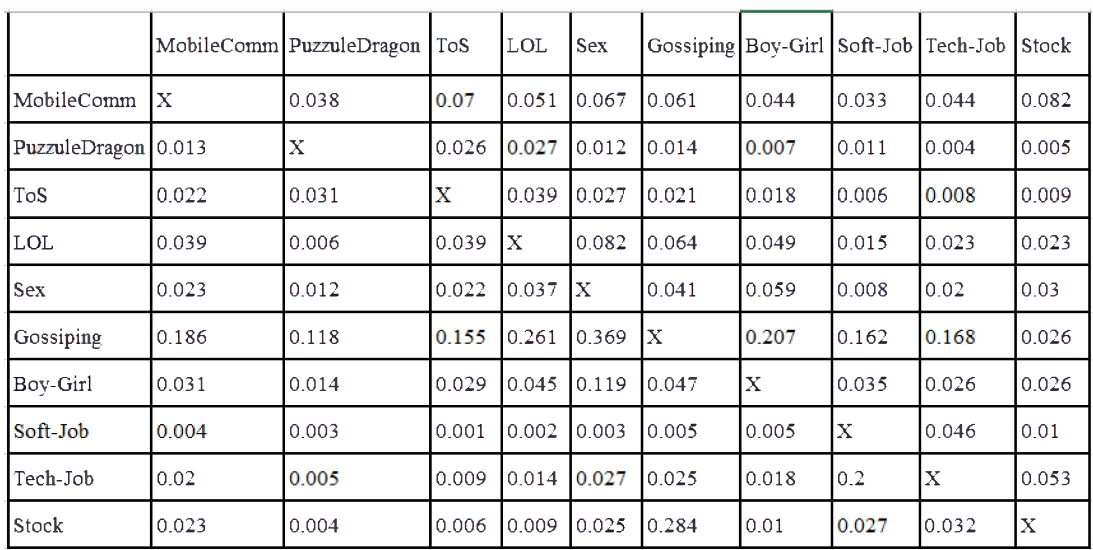 Note: The vertical axis represents the source board (Board A) and the horizontal axis represents the target (Board B).