
Decoding Human Mobility: The Trinity of Trend, Periodicity, and Surprise in LBSNs
User Behavior Analysis of Location-Based Social Network
This paper presents a comprehensive analysis of user behavior in Location-Based Social Networks (LBSNs) using check-in data from Gowalla and Brightkite. It identifies and defines three core behavioral features—Trend, Periodicity, and Surprise—to better understand the non-random nature of human mobility for improving POI recommendation and next-location prediction.
TL;DR
Human behavior is rarely random. By analyzing check-in data from Foursquare-era giants like Gowalla and Brightkite, this research proves that user movements are governed by three distinct temporal signatures: long-term Trends, cyclical Periodicity, and unexpected Surprises. Understanding these is the secret to moving beyond static POI recommendations toward truly intelligent, context-aware predictions.
Background: The Hidden Logic of "Checking In"
In the world of Location-Based Social Networks (LBSNs), a "check-in" is more than just a coordinate; it is a footprint of human intent. While previous SOTA (State Of The Art) methods focused heavily on spatial proximity, they often missed the "Why" and "When." This paper argues that before we build complex neural networks, we must first understand the fundamental pulse of the data.
The Problem: The Chaos of Heterogeneous Data
Most current recommendation systems struggle with two things:
- Data Sparsity: Users only check in at a fraction of possible locations.
- Temporal Blindness: Systems often treat a Monday morning coffee stop the same as a Saturday night festival visit.
The authors argue that without identifying the nature of the time slot, models cannot accurately differentiate between a user's "routine" and their "exploratory" behavior.
Methodology: The Three Pillars of Analysis
The researchers propose a framework to dissect behavior into three manageable features:
1. Trend (The Direction)
Trend represents the macro-evolution of the network. For instance, the general rise in LBSN popularity in 2009-2010 represents a rising trend that provides a baseline for future traffic volume predictions.
2. Periodicity (The Rhythm)
This is the most powerful predictor. By analyzing data at the weekly level, the authors found a consistent "5+2" rhythm—five days of climbing activity (workdays) followed by two days of distinct shifts (weekends).
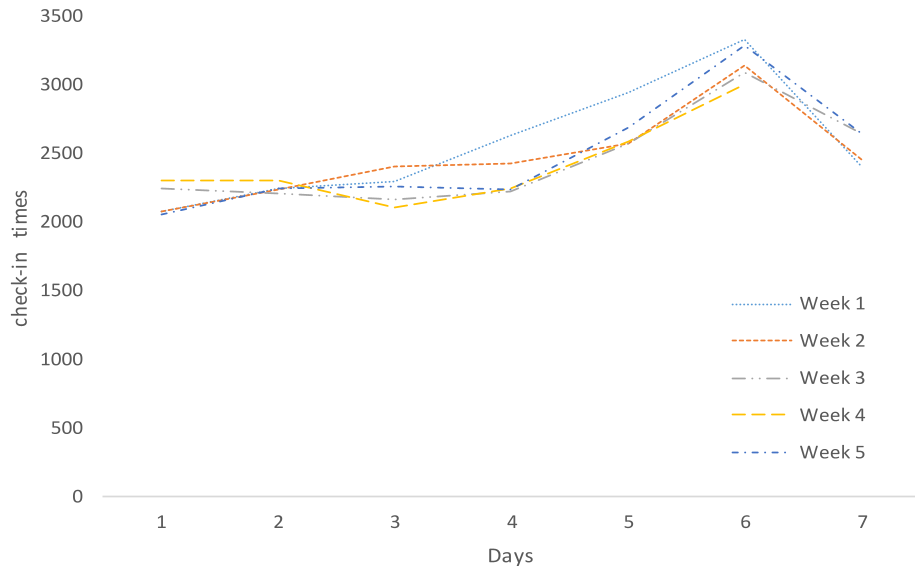 Figure 7: The periodicity of check-in times across different weeks shows consistent behavioral loops.
3. Surprise (The Outlier)
"Surprises" are sudden, non-periodic events that spike data volume. A classic example cited is the SXSW conference in March 2010, where check-ins skyrocketed due to a specific event rather than a change in routine.
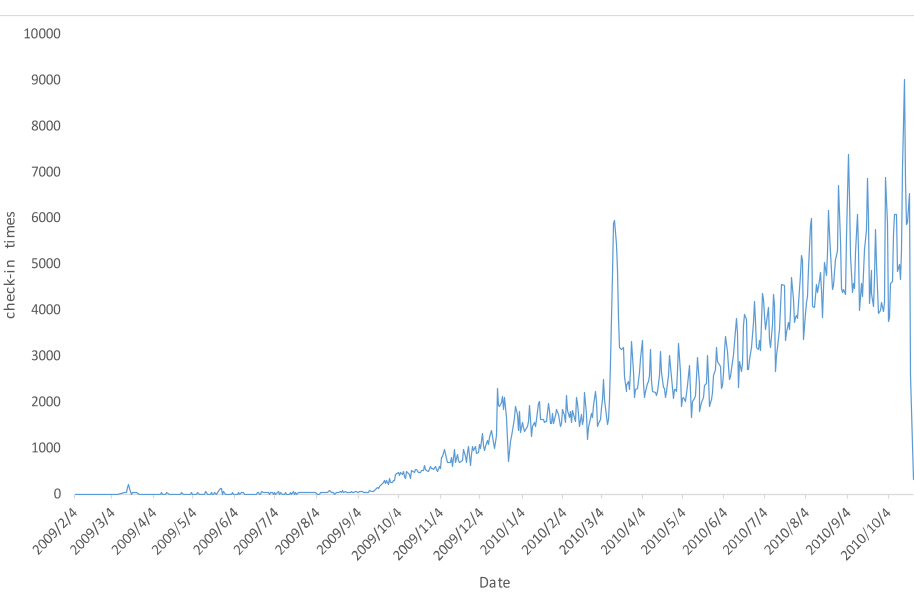 Figure 3: A "Surprise" event in early 2010 showing a dramatic departure from the standard trend.
Experiments & Results: Beyond Randomness
Using the Gowalla and Brightkite datasets, the authors validated that:
- Seasonality matters: Large holidays like Easter (April 4, 2010) create "Special Periodicity" that deviates from the standard weekly loop.
- Granularity is key: Instead of arbitrary 24-hour windows, splitting time into working days vs. rest days provides a much cleaner signal for POI recommendation engines.
By recognizing "Surprises," developers can implement "noise-filtering" or "event-aware" mechanisms to prevent these outliers from skewing the long-term preference profile of a user.
Critical Insight: Why This Matters for the Future
The real value of this paper isn't just in the analysis—it's in the Inductive Bias it provides for future models. If we know that behavior is periodic, we should design architectures (like LSTMs or Transformers with periodic positional encodings) that naturally capture these cycles.
Limitations & Future Work
While the paper provides a solid taxonomy of behavior, it stops short of providing a unified mathematical loss function to integrate these three features directly into a recommendation model. The authors suggest that their next step—and indeed the industry's next challenge—is building models that can automatically switch between "routine-mode" (periodicity) and "discovery-mode" (surprise).
Conclusion
User behavior in LBSNs is a symphony of routine and randomness. By isolating the Trend, Periodicity, and Surprise, researchers can move from "guessing" where a user will go to "knowing" based on the temporal context of their life.