
Decoding SNS Quality of Experience: Why Typical User Behavior is the Key to 5G Optimization
User behavior and user experience analysis for social network services
The paper titled "User behavior and user experience analysis for social network services" presents a methodology for evaluating Quality of Experience (QoE) in Social Network Services (SNS) by identifying "typical user behaviors." Through large-scale data analysis and field testing, the authors demonstrate that SNS user actions follow a centralized distribution, which can be leveraged to build realistic and scalable test scenarios for 5G-era networks.
Executive Summary
TL;DR: This paper argues that the secret to evaluating user experience in social networks isn't just measuring "speed," but understanding the "rhythm" of user actions. By analyzing over 60,000 users, the researchers found that social media behavior is highly aggregated and predictable, allowing for the creation of "typical behavior scripts" that can simulate complex, real-world network loads more accurately than traditional data models.
Positioning: This work serves as an empirical bridge between user behavioral science and network engineering, moving QoE evaluation away from generic traffic models toward behavior-centric simulation.
The "Blind Spot" in Network Testing
Modern mobile operators use Deep Packet Inspection (DPI) and intelligent scheduling to prioritize traffic. However, our testing systems haven't kept up. Traditional models treat data like a generic "water flow," but SNS traffic is "bursty" and context-dependent.
The authors identify a critical gap: Prior work focuses on the frequency of actions, but ignores the specific "communication angle"——how the fluctuation of user actions under different scenarios (like a quiet office vs. a busy restaurant) impacts the actual perceived delay.
Methodology: From Aggregation to Simulation
The authors' core insight is the Aggregation Phenomenon. Unlike FTP or VoIP, SNS users show high PEARSON correlation in their habits. If we know how a "typical" student or office worker behaves, we can simulate thousands of them to stress-test a network.
The Mathematical Backbone
The paper uses a Poisson distribution to model the number of services over time :
Combined with geometric distributions for the number of data flows () and data length (), they create a scriptable model for network traffic.
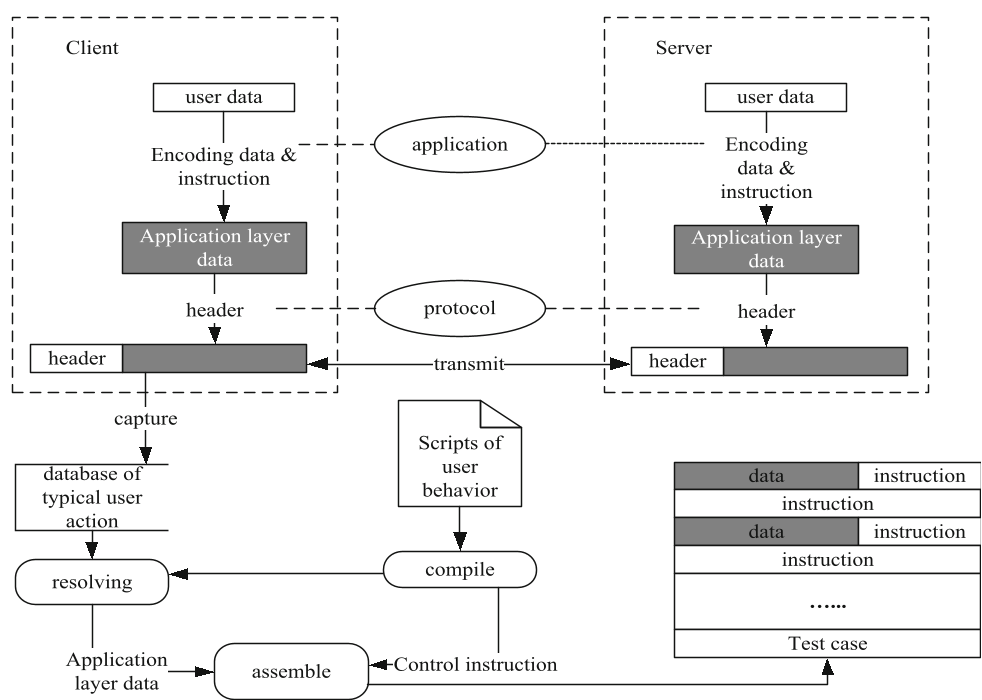 Figure 1: The architecture for translating real captured data into reusable behavior scripts for simulation.
Experimental Evidence: The Fingerprints of Social Media
The researchers analyzed usage patterns on platforms like Weibo and QQ to validate their theory of "Central Distribution."
- Action Concentration: Most users perform a very limited set of actions (Login, Post, Comment).
- Data Size Concentration: On Weibo, the vast majority of posts are tiny, clustered between 10 and 50 bytes.
- The "Jitter" Discovery: In the same geographical area with the same signal strength, different "scenes" (Office vs. Restaurant) produced vastly different QoE.
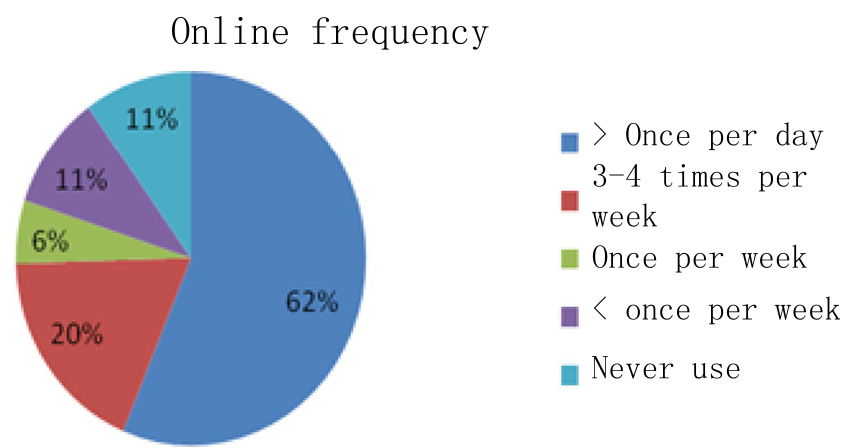 Figure 2: The centralized "heavy-tailed" distribution of Weibo post lengths, showing how predictable user data footprints actually are.
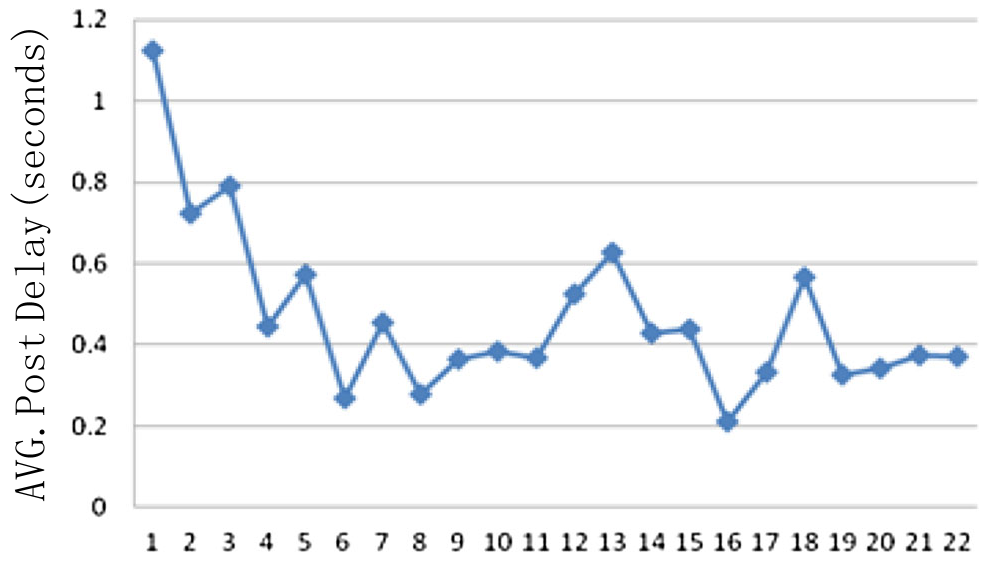 Figure 3: Real-world delay testing across different scenarios, proving that behavior, not just infrastructure, dictates the experience.
Deep Insight & Conclusion
This paper concludes that user behavior is the primary variable in modern network performance. As we move further into the 5G/6G era, "one-size-fits-all" network testing is obsolete.
Takeaways for the Industry:
- Stop testing for "peak throughput" only: Start testing for "behavioral jitter."
- Modular Test Cases: Test scenarios should be built by mixing and matching "typical behavior scripts" (e.g., 20% "Active Posters," 80% "Silent Readers").
Limitations: While the paper excels at characterizing SNS, the impact of high-bandwidth social content (like TikTok/Reels) which uses different protocols (QUIC/UDP) might require more complex modeling than the Poisson/Geometric approach used here for text-based SNS.