
Beyond GPS: Capturing Lifestyle through Semantic Location Similarity
A User Similarity Calculation Based on the Location for Social Network Services
This paper introduces a novel user similarity calculation method based on location semantics rather than physical coordinates. By leveraging a hierarchical location category graph (e.g., Foursquare categories), the method identifies shared lifestyle interests and significantly outperforms the Jaccard Index in person-matching tasks.
TL;DR
Researchers from KAIST have developed a method to calculate user similarity by looking at the meaning of where people go, rather than just the coordinates. By mapping visits to a hierarchical category tree (e.g., "Starbucks" "Coffee Shop" "Food"), the system can identify that two users are identical in lifestyle even if they live on opposite sides of the globe.
Why Physical Location is the Wrong Metric
Most traditional Location-Based Social Networks (LBSNs) calculate similarity based on physical proximity. If User A and User B both live in the same apartment building, they are deemed "similar." However, User A might be a student frequenting the library, while User B is a professional spending nights at bars.
The authors argue that intention is found in the type of place. A user frequenting a theater in New York has more in common with a user frequenting a theater in London than with their own next-door neighbor who never leaves their home office.
Methodology: The Core Intuition
The paper introduces three critical components to bridge the gap between "where" and "what":
1. Significance Score ()
Instead of treating every visit as equal, the authors focus on the top-k visited locations. This filters out "noise" (e.g., a one-time visit to a dry cleaner) and focuses on stable lifestyle traits.
2. Location Category Hierarchy
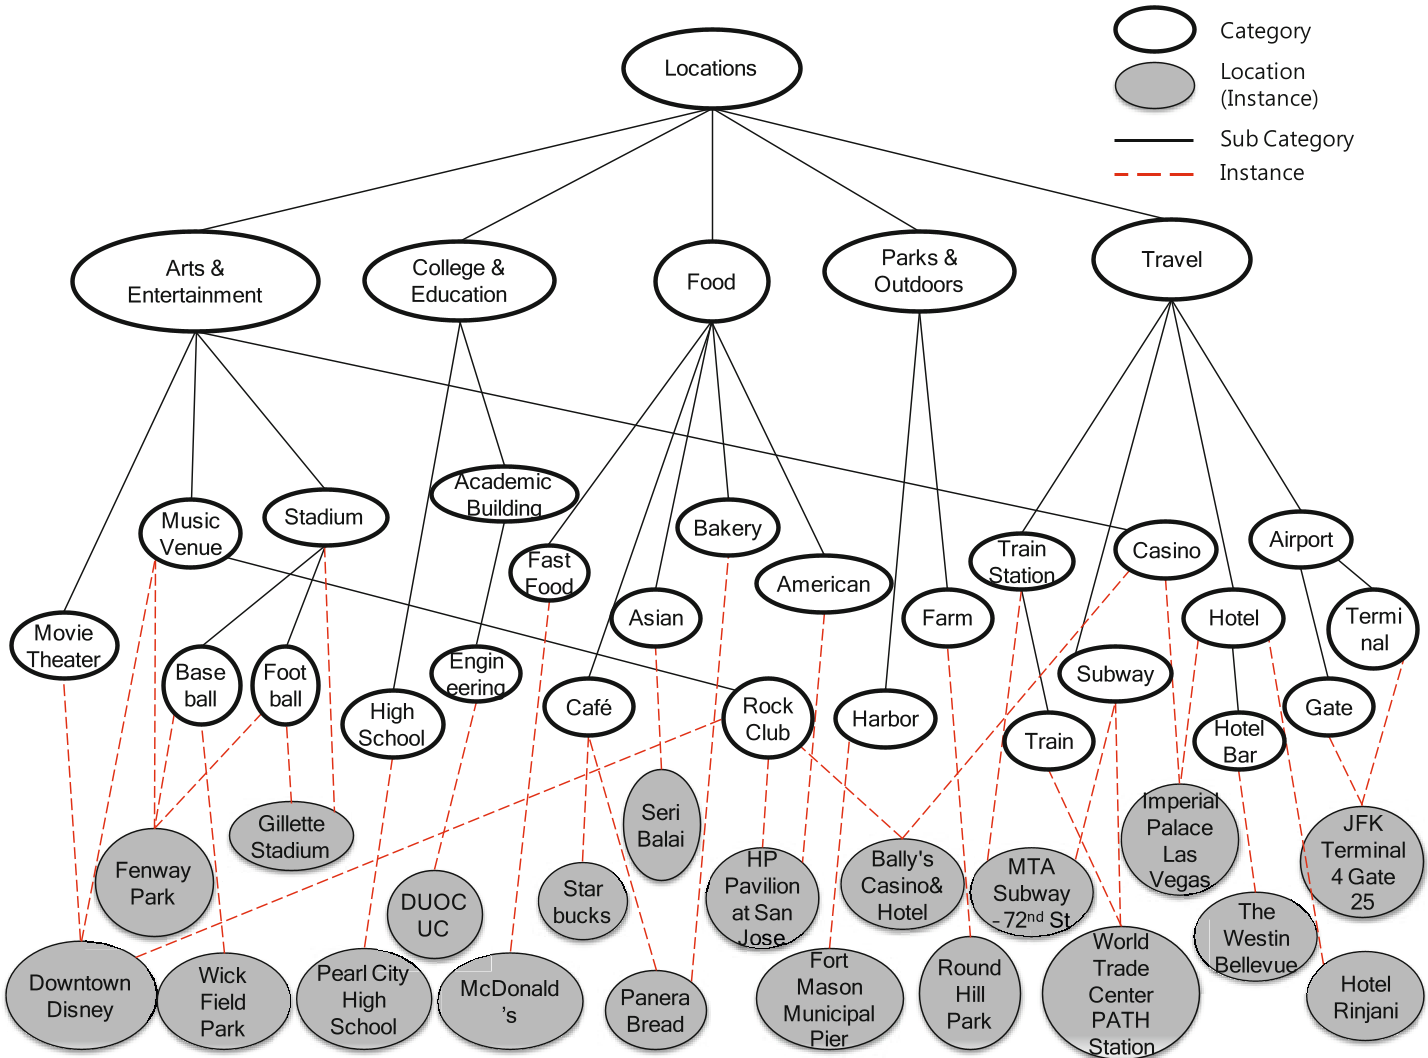
Every location is mapped to a tree. For example, "Gillette Stadium" is a child of "Stadium," which is a child of "Athletics & Recreation."
3. Human-Sense Propagated Similarity
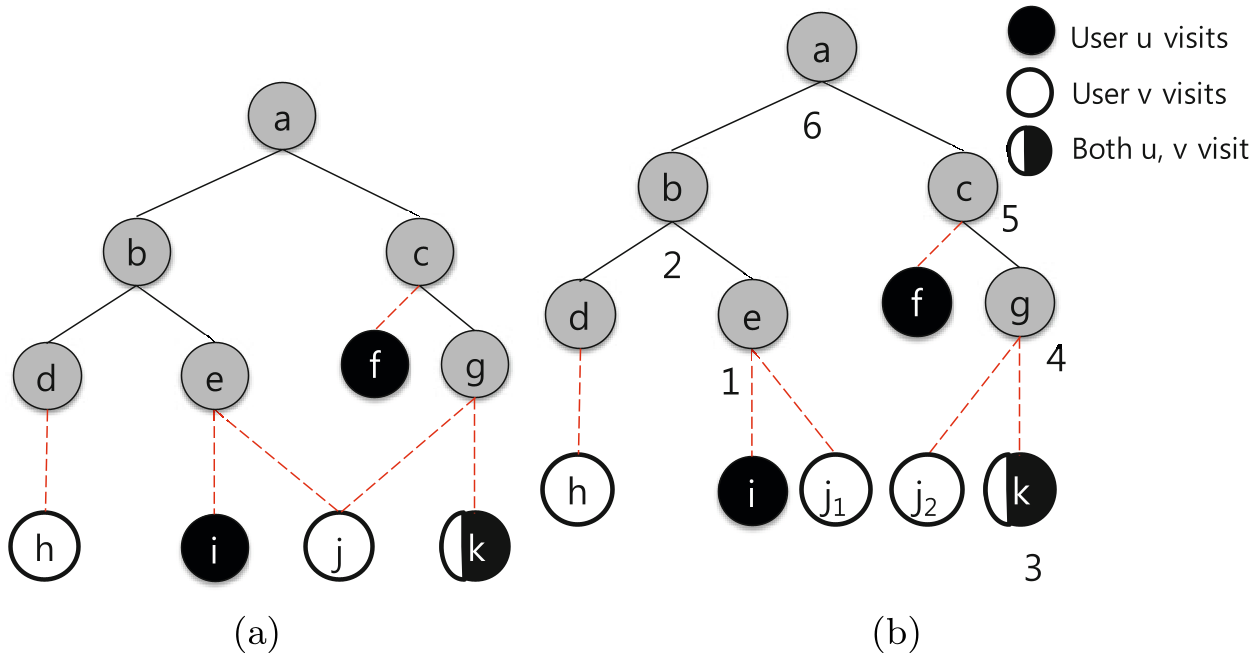
This is the "special sauce." If two users visit the exact same Starbucks, their similarity score is high. But what if they visit different coffee shops? The algorithm propagates the significance score up the tree to the common ancestor ("Coffee Shop").
The propagation is weighted by a Propagation Rate (PR), which uses a logarithmic scale to account for "choice density." If a category has hundreds of sub-options (like "Restaurants"), matching in that category is statistically more significant than matching in a category with only two sub-options.
Methodology Visualization
The process involves splitting location nodes with multiple parents and calculating scores in a post-order traversal of the match nodes.
Experimental Battle: Proposed vs. Jaccard Index
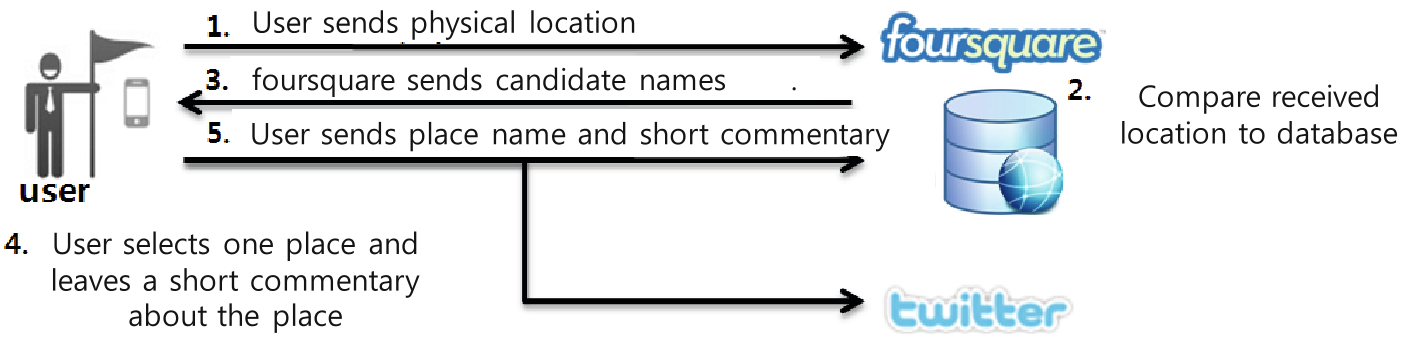
The authors tested their framework using 251,000 "check-ins" from Foursquare. They compared their method against the Jaccard Index, the industry standard for set similarity.
Performance Gains:
- Precision: +84%
- Recall: +61%
- F-Measure: +72%
The study also revealed a fascinating insight into human behavior: Top-20 locations usually account for over 55% of all user activity. Including more than the top-50 locations actually decreases performance, as infrequent, non-representative visits begin to clutter the user profile with noise.
Critical Insight & Future Work
The brilliance of this paper is its simplicity—it uses hierarchical logic to mimic how humans perceive commonalities. However, it currently relies on a static hierarchy.
Future Outlook: As we move toward more dynamic social graphs, combining these semantic location scores with temporal data (e.g., when do they visit the coffee shop?) or user-generated tags could refine these similarity scores even further, creating the "ultimate" friend-recommendation engine for the mobile era.