
VASA: Steering the Symphony of Critical Infrastructure Simulations
VASA: Interactive Computational Steering of Large Asynchronous Simulation Pipelines for Societal Infrastructure
VASA is a visual analytics platform designed to model and manage the impact of societal threats on critical infrastructure using a distributed "system-of-systems" simulation pipeline. It integrates multiple high-fidelity models (weather, power, supply chain, and routing) through a central Workbench that uses local simulation proxies to enable real-time interactive computational steering.
TL;DR
VASA (Visual Analytics for Simulation-based Action) is a breakthrough platform that transforms slow, monolithic simulation pipelines into interactive "system-of-systems." By utilizing simulation proxies for immediate feedback and a modular REST-based architecture, VASA allows analysts to steer complex scenarios—like hurricanes hitting a supply chain—in real-time, bridging the gap between deep computation and administrative decision-making.
Background: The Complexity of Interdependence
Our world runs on a fragile web of highways, power grids, and supply chains. When a hurricane strikes, it doesn't just cause wind damage; it triggers a cascade: power outages shut down food processing centers, which disrupts distribution, potentially leading to spoilage and food-borne illnesses. Modeling this requires "System-of-Systems" (SoS) simulations, but these are notoriously difficult to use because they are slow, complex, and data-incompatible.
The Problem: The "Interactive Gap"
Data analysts in homeland security or logistics are often "casual experts." They understand the domain but aren't simulation scientists. Common hurdles include:
- Execution Time: High-fidelity models take hours; interactive analysis requires milliseconds.
- Monolithic Rigidness: Models for weather and traffic weren't designed to "talk" to each other.
- Complexity Overload: Too many parameters make it impossible for non-experts to explore "what-if" scenarios effectively.
Methodology: Proxies and Pipelines
VASA solves these issues by reimagining the simulation architecture.
1. The Simulation Proxy (The Secret Sauce)
The core innovation is the Simulation Proxy. While the high-fidelity remote server calculates the precise 10-hour result, a local proxy provides a "best guess" approximation instantly. This allows the user to manipulate a hurricane's path and see the estimated power grid failure immediately.
2. Loosely Coupled Architecture
VASA uses a RESTful API to standardize communication between four key components:
- Weather: Pulls real-time and historical storm data (ADCIRC/NOAA).
- Infrastructure: A rule-based environment (Vu) that models cascading failures in the power grid and transport.
- Supply Chain: Tracks product movement from farm to fork.
- Routing: Dynamically recalculates truck paths based on "road barriers" created by flood zones.
 Figure 1: Conceptual overview of VASA Workbench binding distributed simulation components.
Insights from the Workbench
The VASA Workbench provides a spatiotemporal dashboard where users can "play" with time. By dragging a storm contour, the analyst initiates a computational steering loop:
- Adjust: Set power plant wind tolerance to 34 knots.
- Estimate: Proxy shows 200 restaurants lose power.
- Refine: High-fidelity model confirms the route blocks and calculates $1M+ losses.
- Mitigate: Reroute distribution centers to unaffected regions.
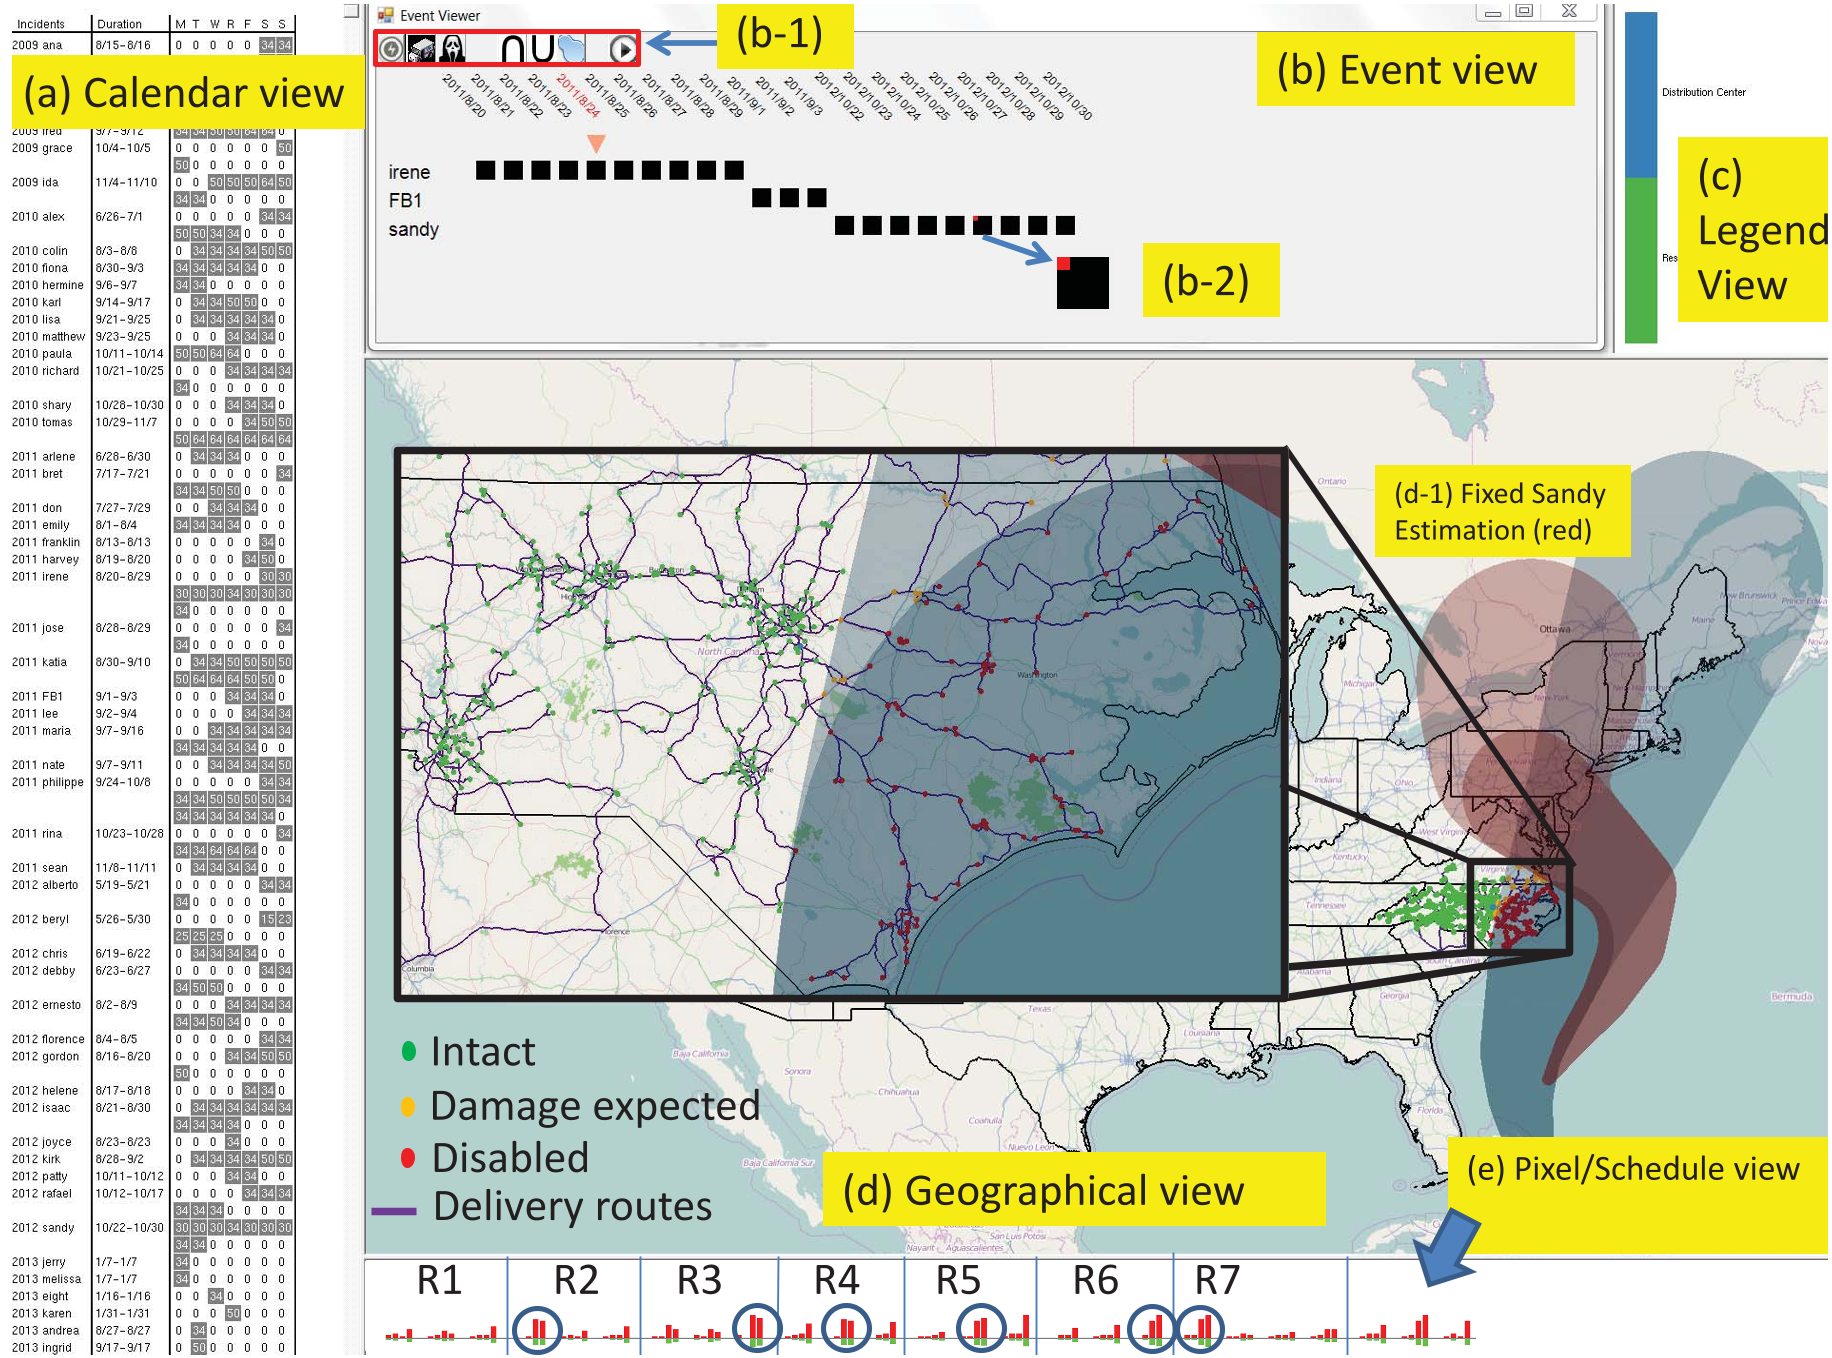 Figure 2: The Vu environment showing the rule-based cascading impacts on the electric grid.
Real-World Impact: Hurricanes and Tracebacks
In a case study involving Hurricane Irene, VASA demonstrated how changing infrastructure resilience (e.g., making power units resist 50-knot winds vs. 34-knot winds) could be visualized instantly, showing a reduction in estimated losses from 333K.
In food safety, VASA uses "Traceback Analysis." By overlaying illness hotspots onto supply chain delivery schedules, analysts can identify "hidden nodes" or specific delivery lots that likely caused contamination, even when the data spans different companies.
Conclusion and Deep Insight
The brilliance of VASA is not just in the simulations themselves, but in the human-in-the-loop steering. By accepting "partial correctness" for the sake of "interactive speed," VASA enables a conversational style of analysis.
Limitations: Currently, the system relies on pre-computed ensembles for some speed gains and requires high-quality GIS data which isn't always available globally.
Future Outlook: As we move toward "Digital Twins" of entire cities, the VASA approach of combining heterogeneous, distributed models into a steerable pipeline will likely provide the blueprint for future societal resilience.