
Decoding the Play: The Video Game Industry through the Lens of Social Network Analysis
Video Game Industry as a Social Network
This paper explores the evolution of the video game industry (1977-2011) by modeling it as a complex social network. Using data from 14 consoles across five generations, it maps the hierarchical relationships between consoles, publishers, developers, and titles to identify maturing market patterns and power-law distributions.
TL;DR
Is the video game industry a chaotic mess of titles, or a highly structured machine? This research treats the history of gaming—from the Atari 2600 to the PlayStation 3—not as a series of sales charts, but as a complex social network. By mapping the bridges between publishers and developers, the study reveals that the industry has shifted from a volatile pioneer phase into a mature, consolidated "Power-Law" ecosystem.
Problem & Motivation: Beyond the Sales Figures
In 2011, the video game industry surpassed $60 billion in revenue, yet the underlying structure remained a "daunting task" for newcomers to navigate. Standard industry analysis often focuses on "What sold most." However, this fails to capture the Industry Topology.
The authors argue that raw numbers provide less insight than visual and structural mapping. They highlight that, much like the soft drink industry (where 89% of choices trace back to three giants), the game industry has hidden hierarchies. The goal? To use network science to predict where the industry is going and how a new developer can survive.
Methodology: Mapping the Hierarchy
The researchers built a directed, hierarchical network based on four tiers:
- Console (e.g., Wii, Xbox 360)
- Publisher (e.g., EA, Nintendo)
- Developer (e.g., BioWare, Ubisoft Montreal)
- Title (The individual game)
They used Out-Degree Analysis (how many developers a publisher manages) and Clustering Coefficients to define the "Social Network" of games.
Architecture of an Industry
The following maps illustrate the drastic increase in complexity between the early days and the modern era:
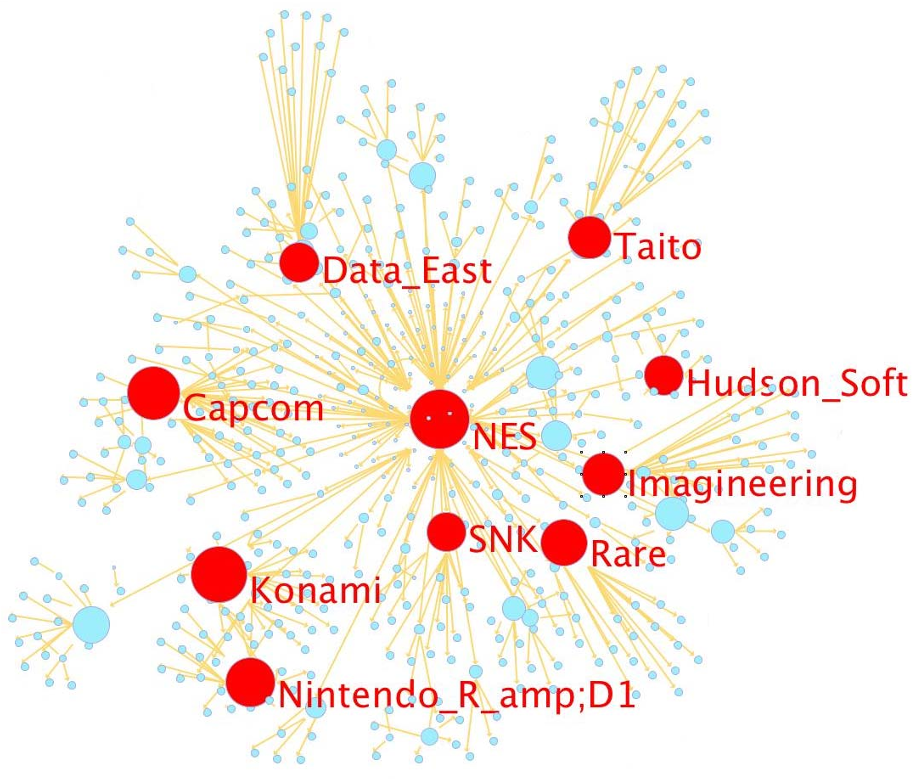 Fig 1: The relatively simple, sparse network of the Nintendo Entertainment System (NES).
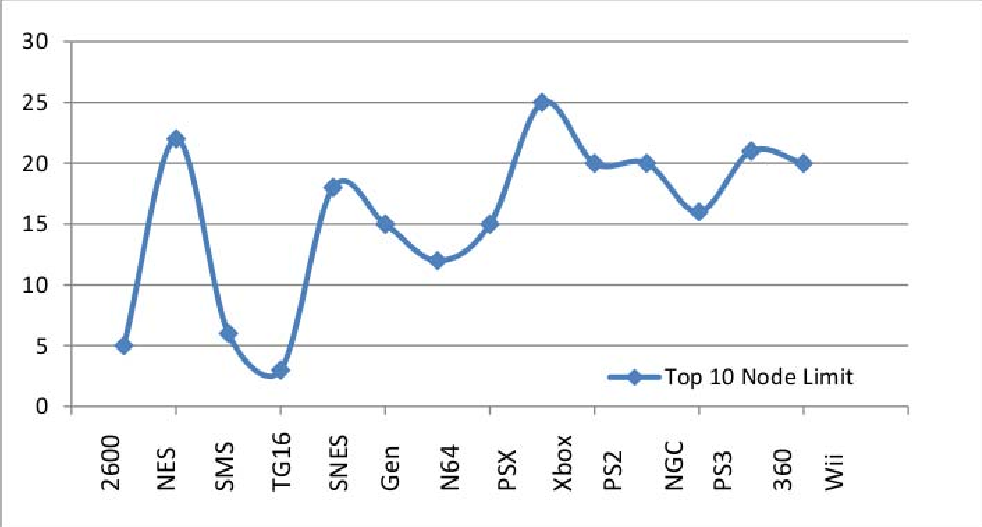 Fig 2: The "Data Blob" of the Nintendo Wii era, showing a significantly more crowded and complex ecosystem.
Experiments & Results: The Rise of the Power Law
The numerical data reveals several critical shifts in the market:
- The "Rule of 2": The industry has stabilized. On average, a publisher maintains ~2 developers per console, and a developer produces ~2 titles.
- The Elite Threshold: While the average is 2, the "Top 10" entities in a console's network (the red nodes in the charts) have an out-degree of 20+. This suggests a massive gap between the average player and the industry titans.
- Power-Law Maturity: In the "Classic" generation (Atari, NES), the distribution of titles was somewhat irregular. In the "Current" generation (PS3/Xbox 360/Wii), the distributions follow a clean Power-Law curve on log-log plots.
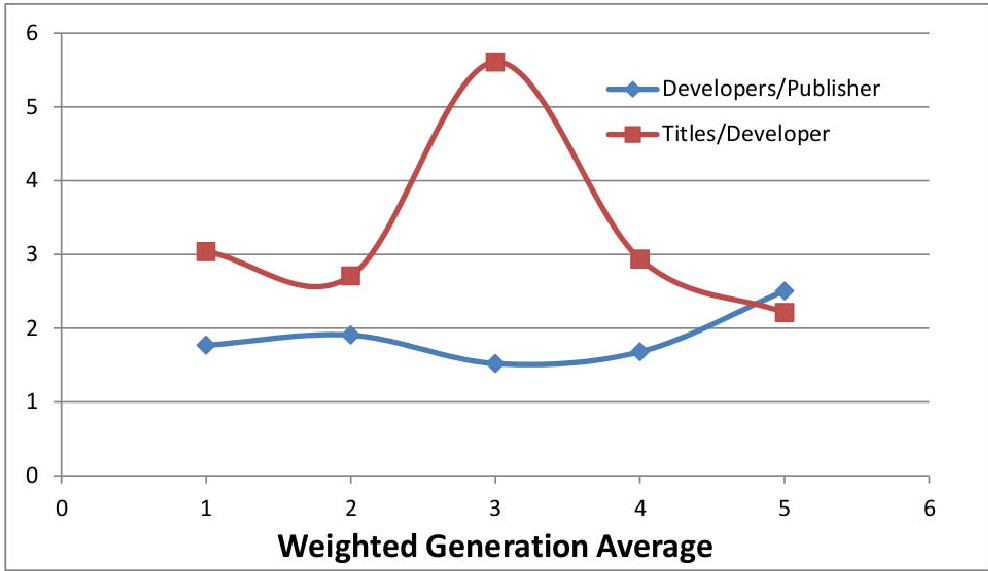 Fig 3: Weighted average of Publisher/Developer/Title distributions across five generations.
The Consolidation Proof
The researchers utilized log-log plots to show that the industry has become more "predictable" in its inequality. Most developers produce very few games, while a tiny handful produces dozens. This pattern is far more consistent in the modern era than in the 1980s.
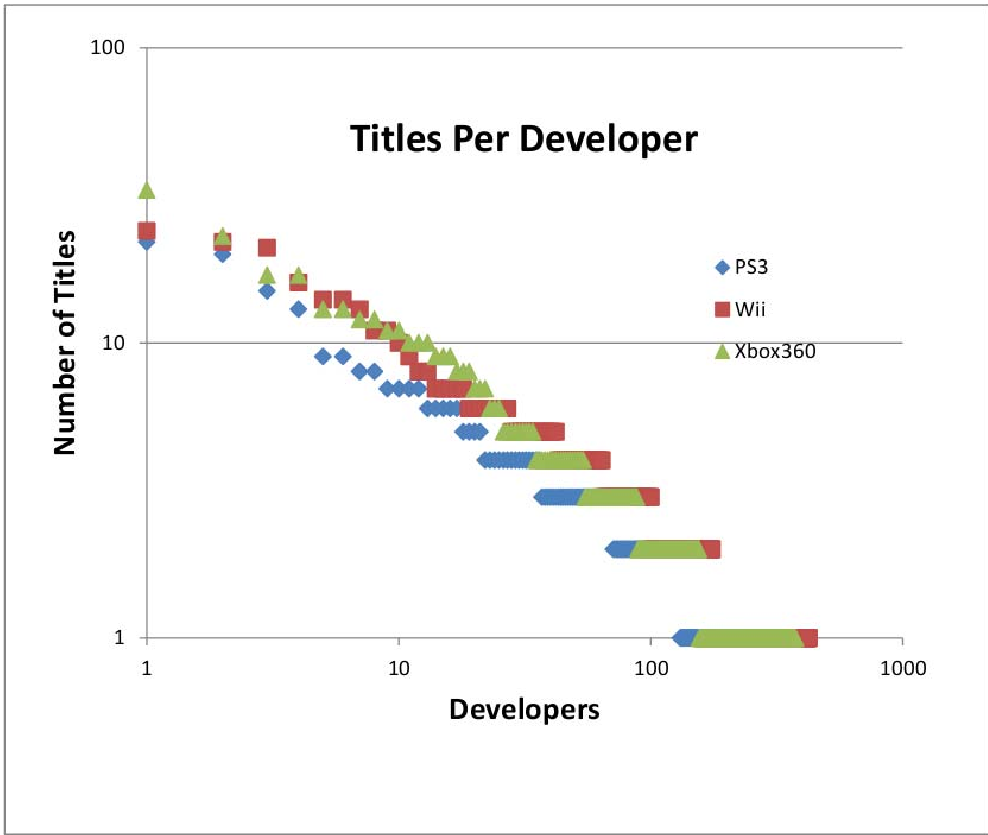 Fig 4: The Current Generation's publisher distribution follows a clear Power-Law, indicating a mature, consolidated market.
Critical Insight: Survival of the Fittest
This paper provides a sobering look for "indie" startups of the 2010 era. The network analysis shows that as consoles gain more nodes, the "central" players hold more power.
Key Takeaways:
- Crowding: The industry is increasingly "crowded." Newcomers aren't just competing with games; they are competing for visibility in a network dominated by nodes with 10x the connectivity.
- Stability: The 2-developer/2-title ratio suggests a "business as usual" rhythm that has emerged after decades of volatility (like the PlayStation 1 spike).
- Limitation: The study primarily focuses on physical/console gaming. A modern extension would need to account for the Digital Distribution / Steam era, where the "Console" node is replaced by a "Platform" node, potentially disrupting these hierarchical structures.
Conclusion
By treating companies and games as social nodes, Morelli and Gunes have shown that the video game industry isn't just about art or software—it is a maturing biological-like system that obeys standard network physics. To win the game, you must understand your place in the web.